Get Ready to Buy the USD/CAD Again
The USD/CAD has recently been a great pair to trade. The technicals are beautifully aligned in the sense that the lower time frames indicate the same trend direction as the higher time frames. For example, the 4-hour chart indicates the same direction as the weekly chart. Look at the following charts:
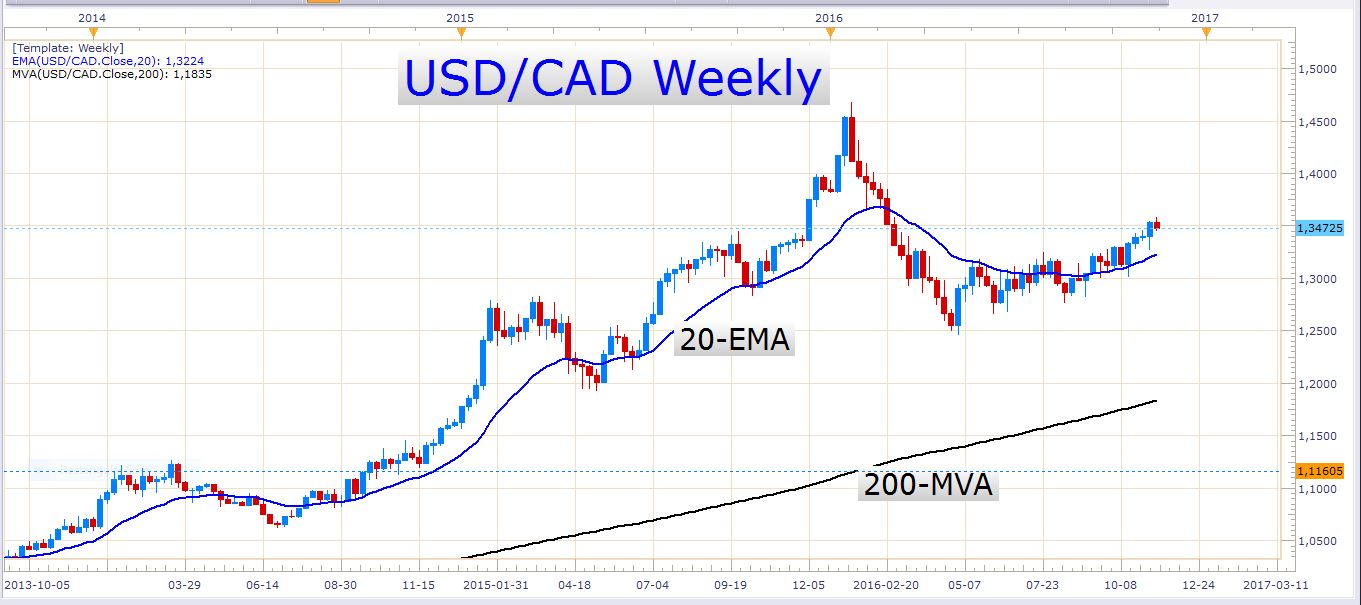
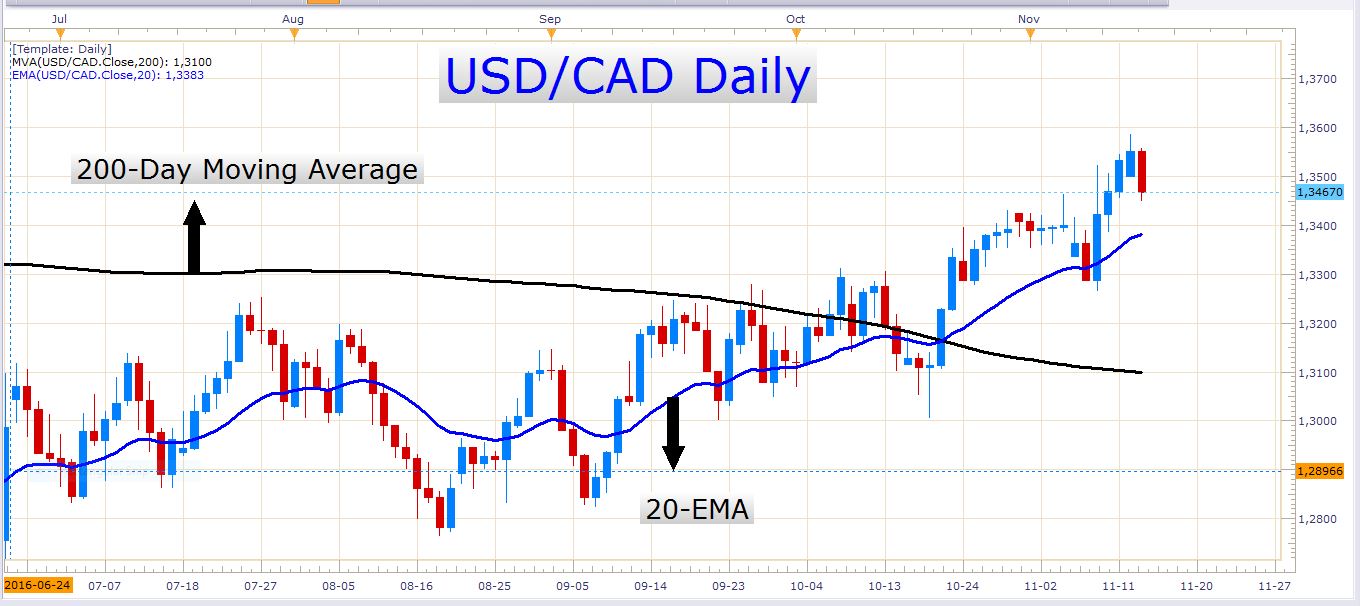

At the moment the pair is forming a rather sharp correction lower. This is probably because of the sharp rise in the oil price today. Look at the following chart:
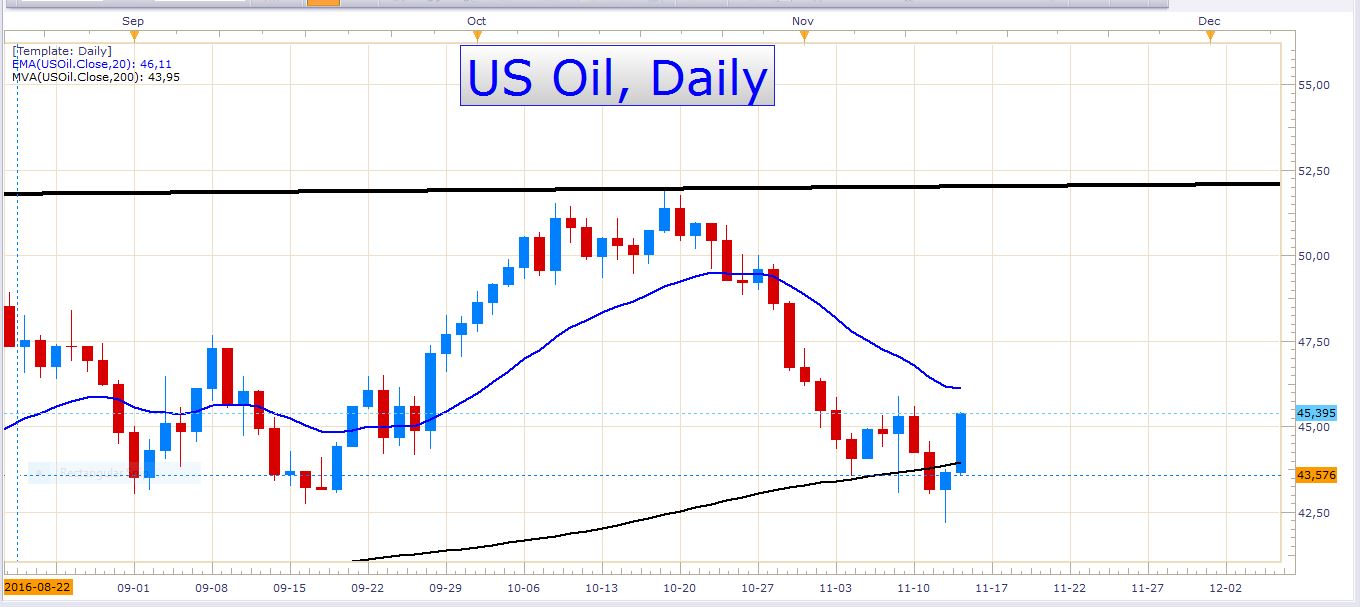
As you can see, the oil price rose aggressively today. As you probably know, the Canadian dollar and the oil price are highly correlated because the Canadian economy is extremely dependent on oil production and export.
The pullback in the USD/CAD exchange rate may present a great opportunity for traders to ‘buy the dip’ once again. Let’s look at the daily chart again:
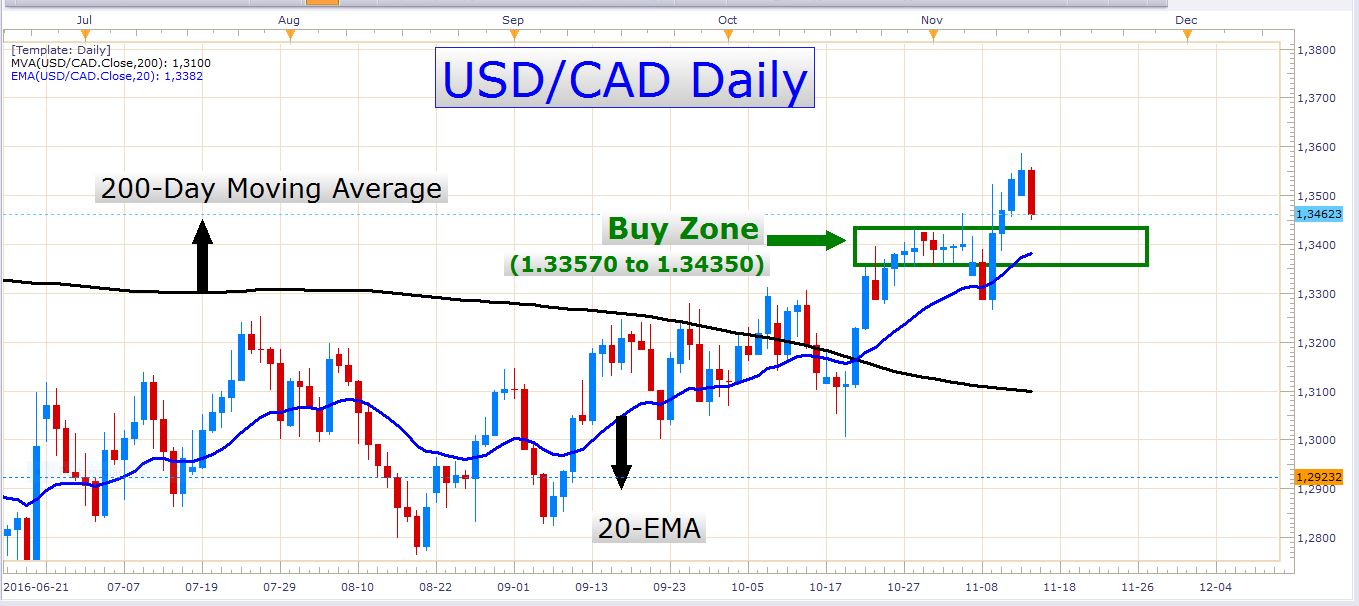
The 20-EMA (blue line) could be a great level to buy the pair at. Even a level close to it could be good, but we’d have to see some signs that the bulls are stepping in again. What I mean by this, is that I’d like to see a couple of downward wicks piercing key levels, and rejecting off of them. These wicks need not necessarily be on the daily timeframe – the 4-hour and hourly timeframes could also do. Other favorable candlestick patterns could also be observed. This would be an indication that the pair has possibly struck some sort of a support zone.
The buy zone I marked on the chart lies between 1.33570 and 1.34350. This level appeals to me because it contains a polarity point where the exchange rate formerly encountered resistance. Remember, that in a healthy uptrend, former resistance zones often turn into zones where support may be found.
If you’re trading Canadian dollar pairs, you need to keep an eye on the US crude oil inventory numbers which are released tomorrow (Wednesday) at 15:30 GMT. If this release moves the oil price significantly, it will have a notable effect on the Canadian dollar.
AUD/USD
It seems like this pair might find support at the 200-day moving average. The price turned around just above this indicator today. Look at the following chart:
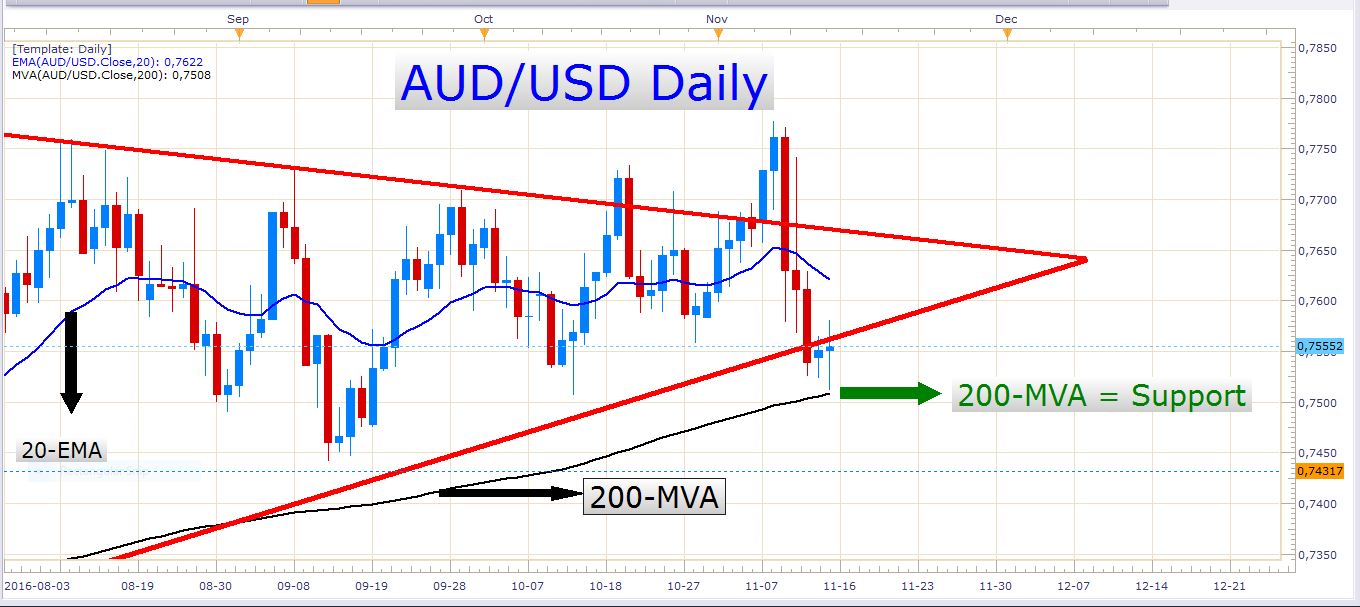
What exactly this pair will do in the next few days is difficult to say, but I wouldn’t be surprised if we saw some more sideways price action unfold.
In a few hours’ time, we have Wage Price Index numbers out of Australia. The release is at 00:30 GMT (Wednesday). This release is not extremely important, but it could have an effect on the exchange rate.
GBP/USD
There is a lot of up and down movement in this pair at the moment. It looks like market players aren’t convinced about which direction to take. The bears failed to produce a close below the 20-day exponential moving average today. This raises the question whether this indicator will continue to support the price for yet a while or not. Look at the following chart:
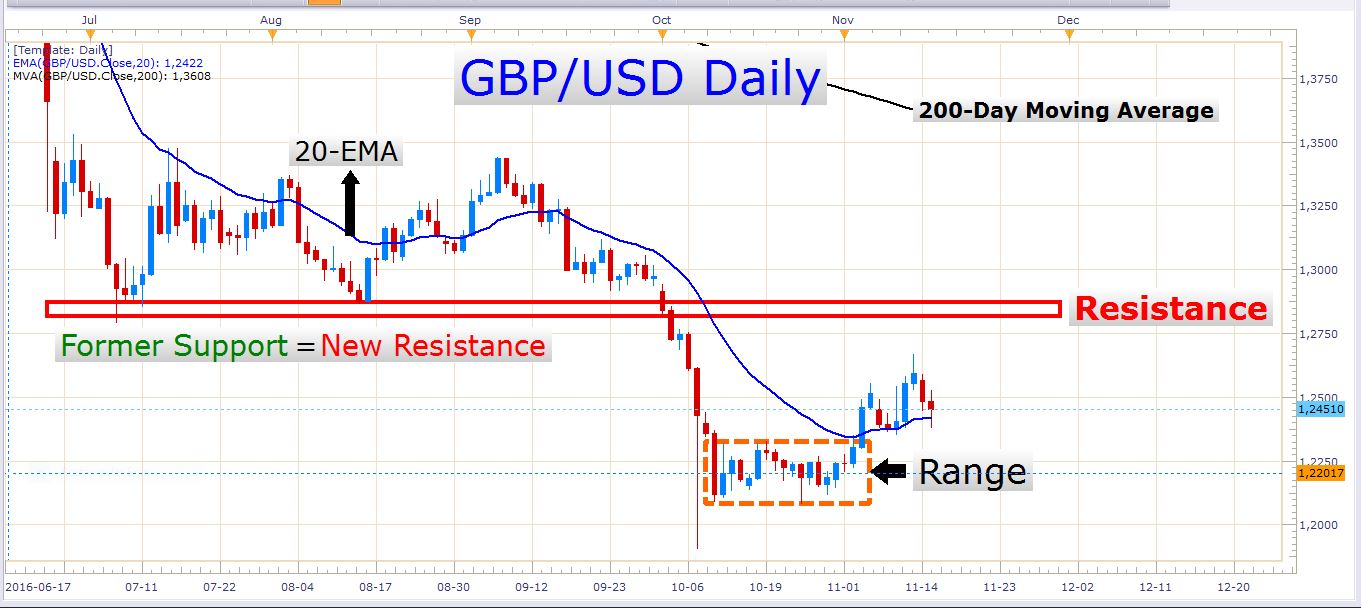
Perhaps we will encounter some sideways chop in the next couple of days. If the Brexit theme delivers some important headlines, this could, of course, move the exchange rate rapidly in a certain direction.
There is important economic data out of the UK tomorrow (Wednesday). The Average Earnings Index number, the Claimant Count Change (Oct), and the unemployment rate will all be released at 09:30 GMT.
Out of the US, we have PPI (Producer Price Index) numbers to be released at 13:30 GMT. I personally don’t expect a massive impact from this release, but it could have an effect on the exchange rates if the number is significantly different from the forecasted number.
Good luck trading!
- Check out our free forex signals
- Follow the top economic events on FX Leaders economic calendar
- Trade better, discover more Forex Trading Strategies
- Open a FREE Trading Account