GBP/USD Sell Signal
These sort of moves, such as the USD surge we have seen in the last few days, bring along some good trading opportunities. But you can easily get caught on retraces as we did last night with our EUR/USD signal. So, we must be careful at any time picking the right levels.
 The 20 SMA is providing some support on the H1 chart.
We just opened a GBP/USD sell signal a little while ago which we will have a quick look at now. As you can see on the H1 GBP/USD chart above, the trend is down and this forex pair has pulled a retrace overnight. This retrace up looks over now since the stochastic indicator is oversold. This is one of the main reasons we issued this forex signal this morning.
The 1.2440-50 level was the low yesterday, which makes it some sort of resistance level. However, the 20 moving average (20 SMA) is just below where the price is right now, which is holding it afloat and thus, going against our signal.
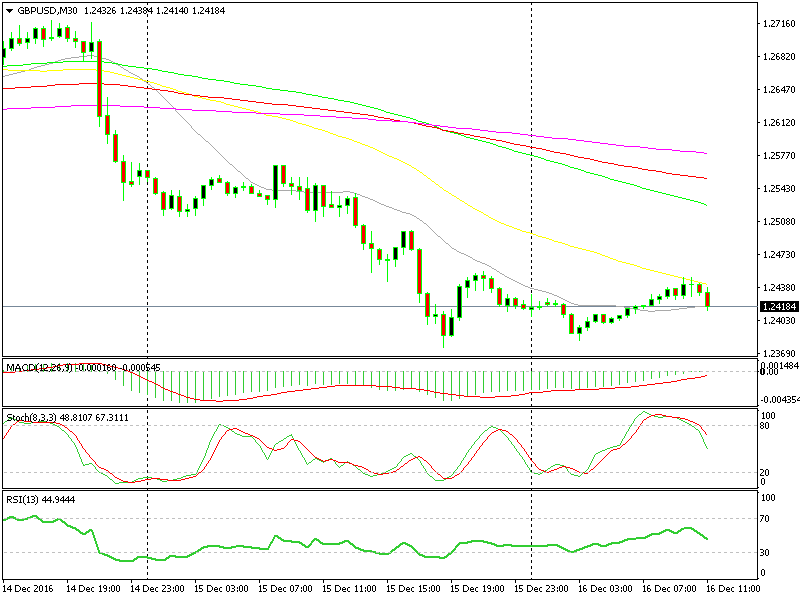
 The 50 SMA in yellow looks too strong on the 30-minute chart.
If we change into a 30-minute chart or a 15-minute chart, the picture looks pretty bearish too. On the 30-minute GBP/USD chart, the 50 SMA is providing resistance on the top, while on the 15-minute chart it is the 100 SMA which is preventing the price from moving further up.
The 20 SMA in grey is still an obstacle, though, for GBP/USD sellers since it stands below where the price is now but… Well, it just hit the take profit target right now, but this is the whole mindset behind that trade.
- Check out our free forex signals
- Follow the top economic events on FX Leaders economic calendar
- Trade better, discover more Forex Trading Strategies
- Open a FREE Trading Account


