Wish I Could Buy USD/JPY
We opened a buy forex signal in USD/JPY on Tuesday as the price retested the 115 level for the second time in a few days. This level held pretty well and we closed that signal manually with more than 100 pips in profit when the price was brushing against the 20 SMA in grey on the daily forex chart, right before Trump went live.
But, no comments about fiscal stimulus left the financial markets disappointed. The forex market fell out of love with the USD with USD/JPY leading the way lower.
I was eyeing the 115 support level for another buy USD/JPY signal, but the decline was too ferocious for my taste so I held back. Now we are more than 100 pips lower, which is an even better place to buy, right?
 Seems like the retrace is over on the daily chart
The daily forex chart agrees with this scenario; the stochastic indicator is already oversold the risk/reward ratio is 100 pips better than buying at 115 and the 50 moving average in yellow is waiting not far below here.
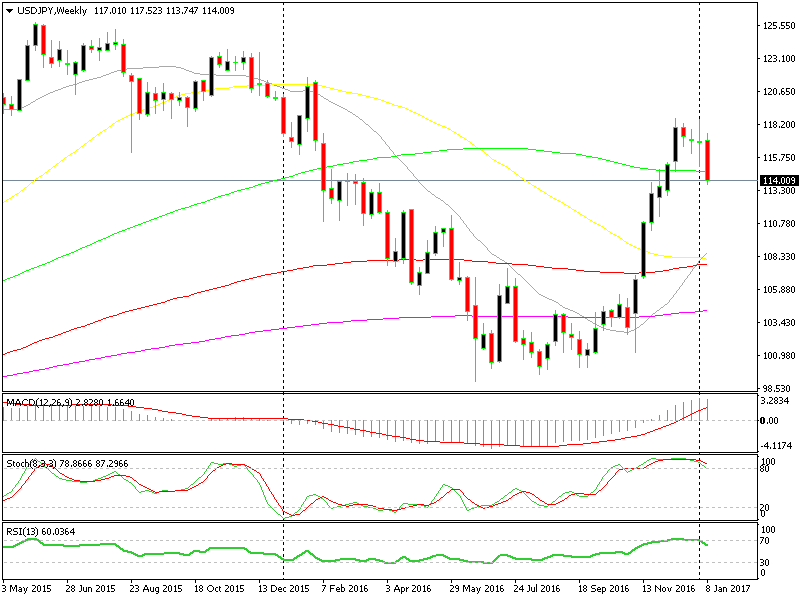
But the weekly and monthly charts don´t agree. As you can see from the chart below, both technical indicators are severely overbought and heading down. Besides that, the 100 SMA in green which has been holding this pair above 115 has been pierced.
It´s not considered a proper break until we close the week below it, but if we do then that would be a big sign that a retrace is underway. After all, this uptrend has been running nonstop for nearly three months now, so a retrace lower is overdue.
 The weekly chart looks bearish though
If that happens, then the 50 and 100 SMAs are well within reach, 600 pips lower. That´s what scares me, I don´t feel brave enough to risk that many pips and the monthly chart doesn´t offer any consolation either for USD/JPY buyers.
The monthly chart is overbought as well and the price is headed down. So, I´m staying put for now, but will keep a close eye on this pair and try to figure out from the price action when it is about to reverse.
- Check out our free forex signals
- Follow the top economic events on FX Leaders economic calendar
- Trade better, discover more Forex Trading Strategies
- Open a FREE Trading Account


