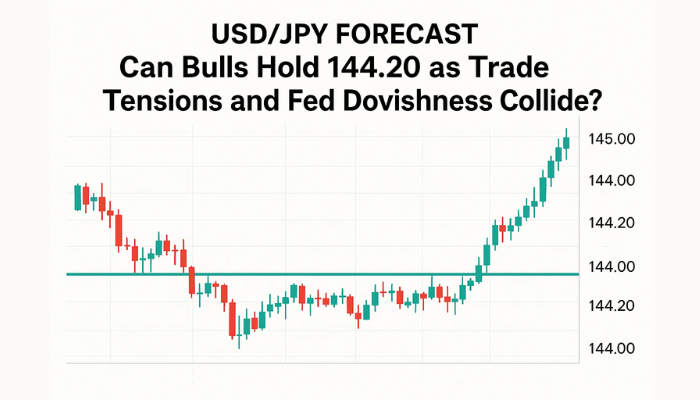
What’s Going On with Our USD/JPY Signal?
We opened this forex signal a few days ago close to the 1.14 support level, but as the hours past, the less confident I was feeling in this signal.
The Buck took a beating after Donald Trump´s speech last week, breaking below 114 and reaching as low as 1.1260 on my trading platform. The bigger risk will be that Trump disappoints market expectations regarding the fiscal stimulus, which everyone is expecting. In that case, 105, here we come again.
Yesterday, though, Yellen must have said some things that the forex market seemed to have liked in relation to the USD because it was the first time the USD pairs found some support since last Wednesday.
USD/JPY surged for more than 100 pips. We commented on this signal yesterday and have now advised to move the stop loss to break-even.
The daily forex chart looks favourable for the buyers because we are trading above the 50 moving average (50 SMA) in yellow, which is providing some sort of support now.
 The 50 SMA in yellow has turned into support.
The H4 USD/JPY chart is worrying for us, so that´s why we think it´s better to move stop loss to break-even. Although you can´t see us do that with the signals, it is due to the fact that we don´t have an option here. Hopefully, we´ll add it soon.
 The 2 moving averages above the current price look a bit worrying to me.
Although, I must say that the 200 SMA in red on the H4 forex chart is also adding strength to this support area. Besides that, the retrace in this forex pair this morning has been the shallowest amongst forex majors, which is an indication that the Yen is feeling pretty weak.
There are more moving averages on the downside in the same timeframe chart, but this all depends on the Buck now. If we see another wave of USD selling, then there´s no technical indicator to hold the price. However, I have a feeling that we are getting close to this USD retrace/pullback that we have seen since 2017 started.
- Check out our free forex signals
- Follow the top economic events on FX Leaders economic calendar
- Trade better, discover more Forex Trading Strategies
- Open a FREE Trading Account


