S&P and Dax Move Into Buy Zones, but be Very Careful Here!
Hello, traders! I spoke to one of my clients today and heard a few stories about traders who failed, and traders who make heaps of money. I actually heard nothing new.
The successful traders were the ones who combined clever trading, good money management, and perseverance. In most cases, the good money management and clever trading only came later, and that’s where their perseverance pulled them through.
The traders who didn’t make it were those who used too much leverage, burned their fingers and gave up before they could master themselves and the markets.
The point I’m trying to make is this: it isn’t easy to learn how to trade. You will have to endure many difficulties, and perhaps you will lose some money in the process. But don’t give up, and never stop learning. Keep on trading until you become profitable. If you’ve lost all your money, trade on a demo account for a while. Your perseverance will pay off in the end.
Let’s examine what the markets have to offer…
S&P 500 – What a Sharp Correction!
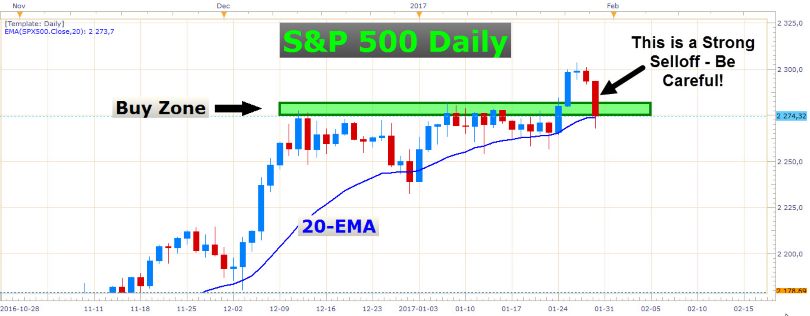 S&P 500 Daily Chart
I don’t like this type of decline when I’m looking for buying opportunities. Although this green box is the ideal area to buy, we need to consider that today’s bearish candle is one of the most aggressive red candles in this screenshot. Look at the size of its body. Do we really want to buy into this setup right away? Sure, if you are an aggressive trader, go for it! But the conservative method would be to wait for a clear signal that this buy zone will hold as support. The way that today’s bearish candle punched impulsively into this buy zone makes me doubt if it will hold as support. It would have been ideal if the price drifted into this buy zone over the space of about four to five trading days and then started showing signs of new buying pressure stepping in. Some downward wicks on either the 4-hour or daily chart would have been perfect. Nevertheless, let’s see how the price reacts to this current level over the next few days. Perhaps the bulls will surprise us with a fresh attack on the recent all-time highs.
Dax – Still Supported
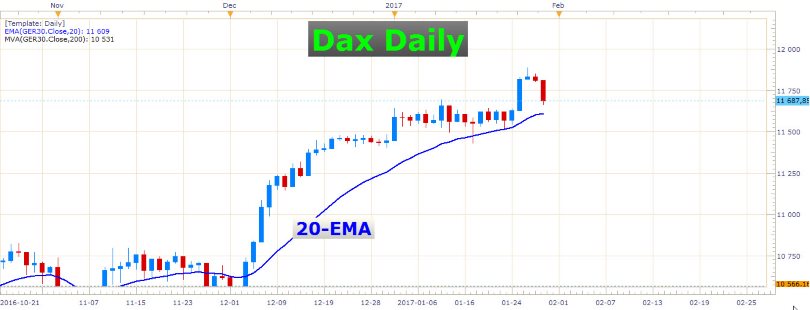
Dax Daily Chart
The Dax also declined today, but not as aggressively as the S&P. You’ll notice that the price has not touched the 20-EMA, and is still in the range of the large breakout candle (the fourth candle from the right). On the other hand, today’s decline on the S&P has taken out the low of its breakout candle. So at the moment, the Dax looks like a better buy than the S&P, although we still need a valid price action signal on the Dax before engaging in long positions.
Nikkei 225 – Still Moving Sideways
 Nikkei 225 Daily Chart
The Nikkei has been lagging behind the S&P and the Dax. I'm not interested in buying this Japanese stock index at the moment, especially after it closed below its 20-day exponential moving average today.
USD/JPY – Failing Once Again
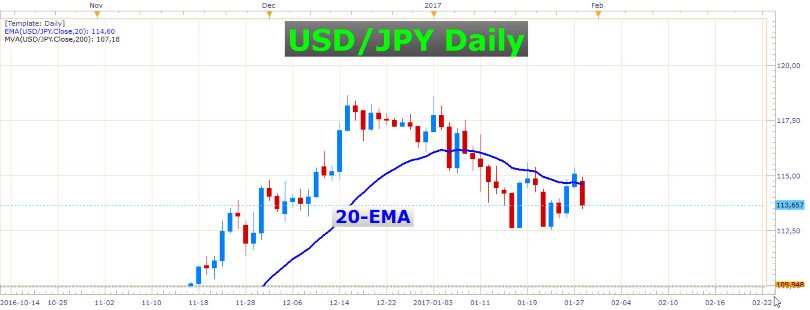 USD/JPY Daily Chart
The USD/JPY rejected off its 20-day exponential moving average again today. This moving average has been a formidable dynamic resistance level over the last few weeks. For now, the technical clues point to some more sideways movement or even a decline in the exchange rate. However, the BoJ (Bank of Japan) is up tomorrow with their interest rate decision, monetary policy statement, outlook report, and press conference. This could cause a decisive breakout from the range in which this pair is currently trading. We’ve seen massive moves resulting from BoJ meetings in the past, so let’s see if they’ll deliver anything meaningful tomorrow.
WTI Crude Oil – Sideways for Now

WTI Crude Oil Daily Chart
For now, the price of crude oil remains supported, especially if the price retains traction above $52 a barrel.
In the chart above, you can see that a triangle pattern has been forming over the last couple of weeks. This kind of consolidation often leads to a break higher, as displayed in this chart. If you’re going to trade this instrument in this way, make sure you wait for a firm daily close above the triangle top before initiating your long position. You want to eliminate false breakouts as far as possible. Just remember that the price could also break through the bottom of the triangle, although the preferred direction is to the topside.
I didn’t write about gold today, but one of our analysts, Mr. Ron Rabinov did. Check out his morning brief for some spot-on analysis on this precious metal, and also where the US Dollar is expected to go. Here is the link: https://www.fxmarketleaders.com/forex-blog/january-30th-morning-brief
News
The most important event tomorrow is the BoJ meeting, but keep an eye on the Canadian GDP number as well, which is at 13:30 GMT.
We also have a speech by ECB President Mario Draghi at 08:30 GMT and European CPI and GDP numbers at 10:00 GMT.
Later in the day, we have the CB Consumer Confidence number out of the USA at 15:00 GMT.
That’s all for now, traders. Stay tuned as we still have much action to cover throughout this week!
- Check out our free forex signals
- Follow the top economic events on FX Leaders economic calendar
- Trade better, discover more Forex Trading Strategies
- Open a FREE Trading Account
- Read our latest reviews on: Avatrade, Exness, HFM and XM
Related Articles


Sidebar rates
Related Posts
