Impressive Day For The USD/CAD, But Will It Find Traction Above Its 200-Day Moving Average?
Hello, traders! It was a pretty average day in the markets today. I suppose there were a few good moves here and there, but nothing phenomenal. At least there was a clean break lower in the USD/JPY today, of which I’m very excited about.
Before we look at the USD/JPY and GBP/JPY, let’s first look at the USD/CAD:
USD/CAD – A Vain Bounce?
The Canadian Dollar really took a beating today and lost about 90 pips against the Buck. I have to say, I’m skeptical about today’s bounce in this pair, especially if we examine the technicals. Let’s look at a daily chart of the USD/CAD:
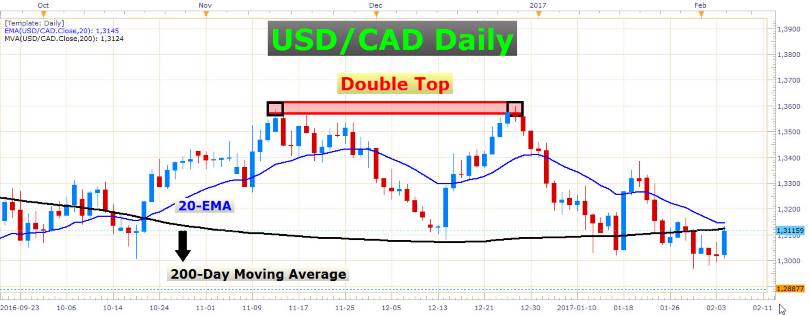 USD/CAD Daily Chart
As you might know, the 200-day moving average is an important gauge used by many traders and investors to determine the trend direction on all kinds of financial instruments. It often acts as a barrier of support or resistance to the price and is something to take note of when trading the markets.
In the chart above, you can see that the USD/CAD is currently testing its 200-day moving average from beneath. This is a relatively strong rise, but the confluence of the 20-day exponential moving average and the 200-day moving average could prove to be a formidable hurdle for this pair to clear.
Much of today’s rise in the USD/CAD can be attributed to the decline in the oil price today. As a major oil producing country, Canada’s currency is highly correlated to the oil price, especially because Canada’s oil reserves lie pretty deep under the earth’s surface, and are more expensive to extract than in some other countries. Here is a chart of WTI Crude Oil:
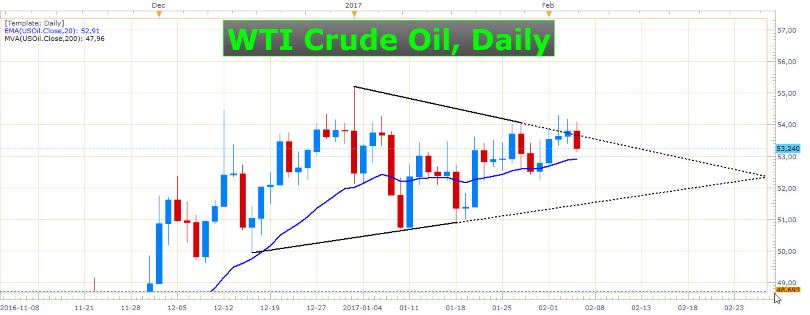 WTI Crude Oil Daily Chart
The price is currently above the 20-day exponential moving average, but as you can see on this chart, this commodity has bumped into some resistance at this triangle top. I won’t be surprised if the oil price moved slightly lower in the next few days.
Let’s not forget about the important economic data out of Canada this week. Tomorrow at 15:00 GMT we have the IVY PMI numbers, and employment numbers on Friday at 13:30 GMT. Besides these numbers, the US crude oil inventories release is on Wednesday at 15:30 GMT. This has the potential to move the oil price, and of course the Canadian Dollar.
The direction of the USD/CAD is dependent on these data events to a certain degree. If you’re trading this pair or other Canadian Dollar pairs this week, you need to be mindful of these news events.
Let’s look at some other instruments…
GBP/JPY – Looking Very Heavy
Many major currency pairs have yielded limited volatility lately, so let's extend today's analysis beyond the major pairs a bit…
The GBP/JPY is known for making large moves in short times. This pair has made a decent move lower over the last couple of trading days. It also closed below its 200-day moving average today, which makes it look even more bearish. Here is a daily chart:
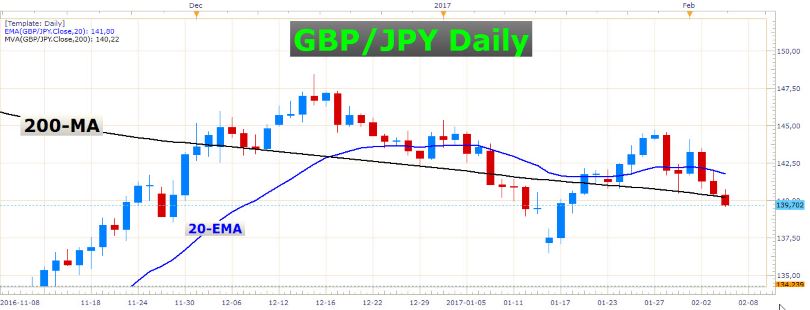 GBP/JPY Daily Chart
Here we have three consecutive bearish daily candles, with the last one breaching and closing below the 200-day moving average. The technical picture of the GBP/JPY is clearly bearish, and a further decline in the exchange can be expected over the next few weeks. Just be careful of chasing the price at this stage – now might not be the perfect time to enter into a short position, except if you’re trading with a very wide stop loss on a weekly chart, for example. The reason I say this is because the pair is somewhat oversold at the moment, and there is more distance between the current price and the 20-EMA than which is desirable. If the pair corrects higher in the days ahead, we might be able to snatch a short entry at a better price. Waiting for a retracement to enter on might cause you to miss a trade, but it could also keep you out of a losing trade.
USD/JPY – Short Trade Unfolding Perfectly
This has been my favorite pair to trade over the last few weeks. If you’ve been reading my articles, you might have gotten yourself into some profitable trades on this pair.
It’s been a long wait, but the break we’ve been waiting for has finally materialized today. Look at this daily chart:
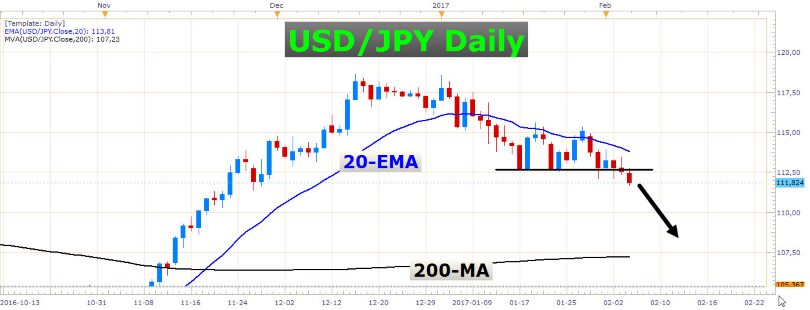 USD/JPY Daily Chart
The USD/JPY consolidated at this black horizontal line for many days before breaking through it today. You might reason that the price had breached this line a few days ago already, but today was the first firm close below this level. Needless to say, my bias on this pair is overwhelmingly bearish, and I’m still holding on to my short positions which I opened on the 20th of January. I will be happy to add to my short positions if I see good opportunities in the days ahead. I will wait for the price to retrace a bit first, just to get that better price to enter at.
All the best with your trading guys!
- Check out our free forex signals
- Follow the top economic events on FX Leaders economic calendar
- Trade better, discover more Forex Trading Strategies
- Open a FREE Trading Account