Where Does GBP/USD Stand Now
So, the UK inflation report was sort of mixed, although in my humble opinion, there was more good than bad in those numbers. Yet, the core inflation missed the expectations and the GBP tumbled to 1.2440.
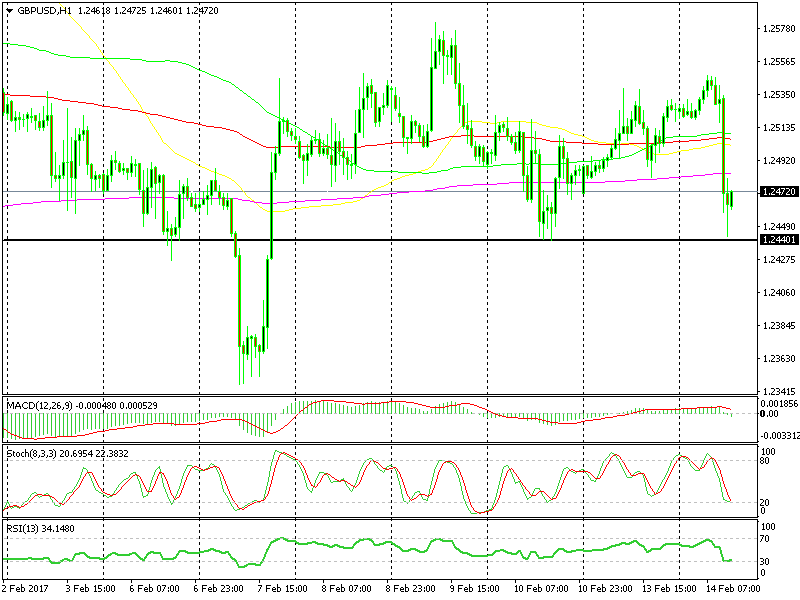
It did so pretty quickly for about 100 pips, but the price stalled right at support. If you look at the hourly GBP/USD chart below, you can see the black line going back to last week which has kept the price from slipping lower a few times.
 The resistance line held on the first attempt.
Going further back, the same level (give or take 10 pips) used to be resistance a few weeks ago, so we can definitely consider this area as a possible buying spot. We missed the first chance when it dipped right after the data was released, still looking for a second wave down.
Switching to the H4 forex chart, we can see the 100 smooth moving average in red hanging in the same area. It held the price well during the lower move, as it has done so on a few other occasions before.
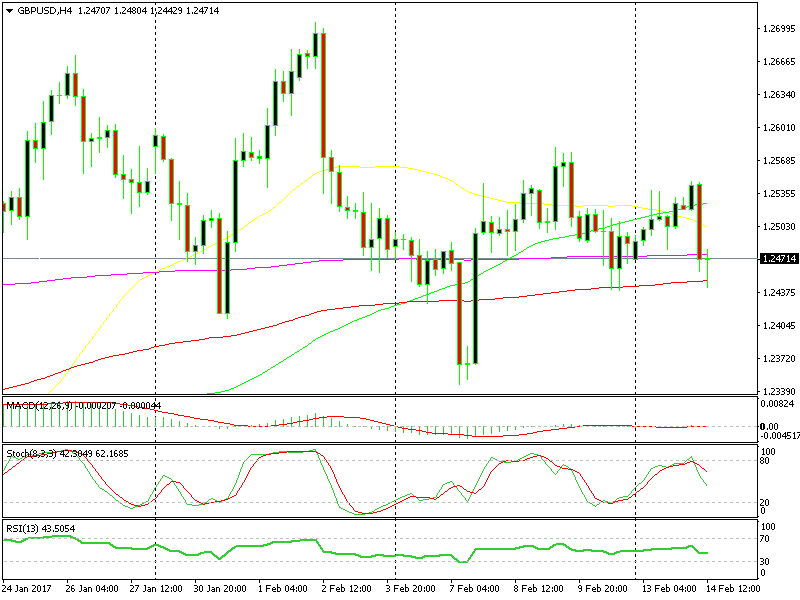 The 100 SMA in red is adding extra strength to this support area.
So, that´s another technical indicator telling us to go long, apart from the recent trend which is up. However, the technical analysis is not as important as it used to be until a few months ago. So take it with a pinch of salt because everything technical is only half a chance right now.
- Check out our free forex signals
- Follow the top economic events on FX Leaders economic calendar
- Trade better, discover more Forex Trading Strategies
- Open a FREE Trading Account
- Read our latest reviews on: Avatrade, Exness, HFM and XM
Related Articles
Sidebar rates
