Where Are Those Orders?
Today is Monday and we haven´t checked the support and resistance levels in major forex pairs since last week. So, let´s have a look at them now, starting with EUR/USD since we opened a forex signal here a while ago.
EUR/USD
Resistance – As we mentioned in our previous update Shorting EUR/USD, the closest resistance level comes at 1.06, but 10 pips lower, we can find the 100 SMA on the hourly forex chart. So, there´s a 10 pips resistance area just above our heads.
The 200 SMA stands about 15-20 pips higher at 1.0615-20, which was the top on Friday. That´s the second resistance level and I expect it to be quite strong.
1.0640-50 is another resistance level but it´s a mild one, so the next decent resistance level comes at 1.0670 where we can find the 200 SMA on the H4 chart. Then, the ultimate resistance at 1.07 is as high as we´re going now.
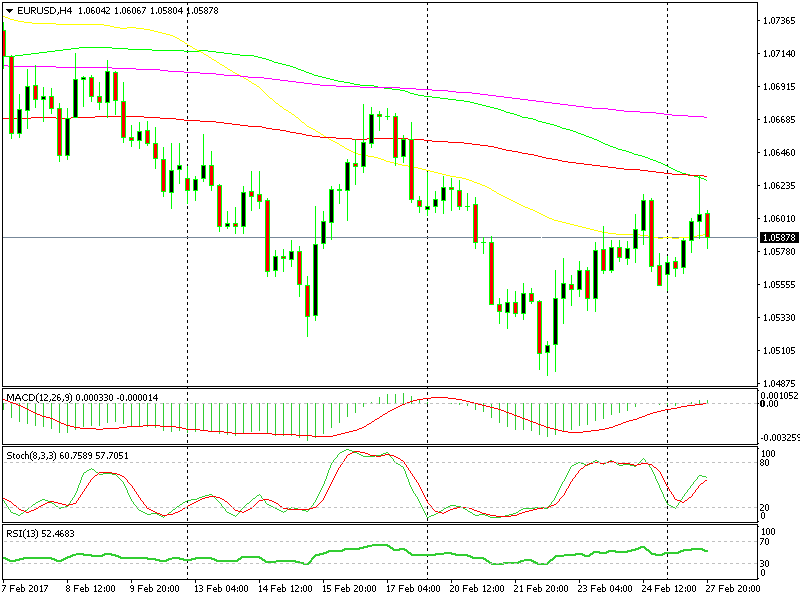 At least we have a few MAs protecting us at the top side.
Support – 1.0550-60 is the first support level and the 100 SMA on the hourly chart comes right there, which makes it even more important. By the way, if we do get down there, it would be more than enough for our signal in this forex pair to reach the take profit target.
1.0520 is also some sort of support, but the real one comes at 1.05, give or take a few pips. Below there, we have the low from 2015 at 1.0450-60, but we´re quite a long way from there right now. Let´s just take it one step at a time.
- Check out our free forex signals
- Follow the top economic events on FX Leaders economic calendar
- Trade better, discover more Forex Trading Strategies
- Open a FREE Trading Account
- Read our latest reviews on: Avatrade, Exness, HFM and XM
Related Articles


Sidebar rates
Related Posts
