Another Ascending Triangle Pattern – the Nikkei
Finally, the sharp bearish trend in the global stocks slows down. This may be a pause, and not an end, because I can see more room for sell-off in the equity markets.
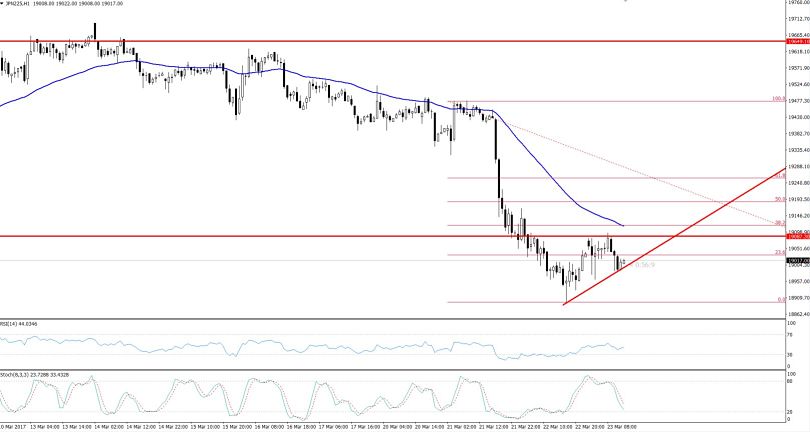
Nikkei – Hourly Outlook
Japanese stock market index, the Nikkei, is trading at $19012 after falling around -0.37%. This accompanies the S&P 500 index, which plunged to a 5 month low of 1.24%. The strong sell off began when Janet Yellen failed to present a favorable economic outlook for the U.S. This resulted in a weaker dollar, soaring safe-haven asset prices and the bearish stock markets.
The market is quite boring today due to thin volatility. As a result, the Nikkei has formed an ascending triangle pattern in the 1- hour chart. Perhaps, we need to wait for a major fundamental release to trade the breakout.
By the way, we may see some action in the early New York session. Let's keep our fingers crossed!
- Check out our free forex signals
- Follow the top economic events on FX Leaders economic calendar
- Trade better, discover more Forex Trading Strategies
- Open a FREE Trading Account


