8 Major Things To Watch Out For This Week
Welcome back traders. We have finally made it to the last week of March. Overall, it was a good, though not the best, trading month. Fed chair Janet Yellen was a major market mover along with U.K acting President Theresa May, who finally declared a date to trigger Article 50 of Brexit. Volatility is expected, but considering the macroeconomic events, it seems like we are going to have another quiet week.
Let’s map out this week based on potential opportunities. In order to do this, I am going to divide this report into two sections. In the first section, we will discuss major macroeconomic events. In the second section, we will see technicals, charts, and potential trading setups.
8 Major Economic Events To Watch This Week
EUR: German Ifo Business Climate (Monday 8:00)
USD: CB Consumer Confidence (Tuesday 14:00)
CAD: Stephen Poloz speaks (Tuesday 15:10)
USD: Crude Oil Inventories (Wednesday 14:30)
USD: GDP data (Thursday 12:30)
USD: Unemployment Claims (Thursday 12:30)
GBP: GDP (Final) (Friday 8:30)
CAD: Canadian GDP (Friday 12:30)
In addition to the macroeconomic events, investors' focus will remain on the political developments in the United States and Eurozone. The tax proposals will now become a major focus if the U.S health care reform is effectively temporarily discontinued. Last but not least, investors will continue to watch for speeches from Federal Reserve officials, though we don't have scheduled speeches from key officials this week.
EUR/USD – The Top Traded Currency Pair
We don't have many economic releases related to the EUR/USD planned for this current week. However, the Eurozone has come up with phenomenal manufacturing and services PMI figures, which not only beat the previous PMI figures but also the forecast figures. Consequently, there is some potential that this economic data could shift the monetary policy expectations over the medium-term by exerting pressure on the ECB president Mario Draghi to adopt a contractionary monetary policy.
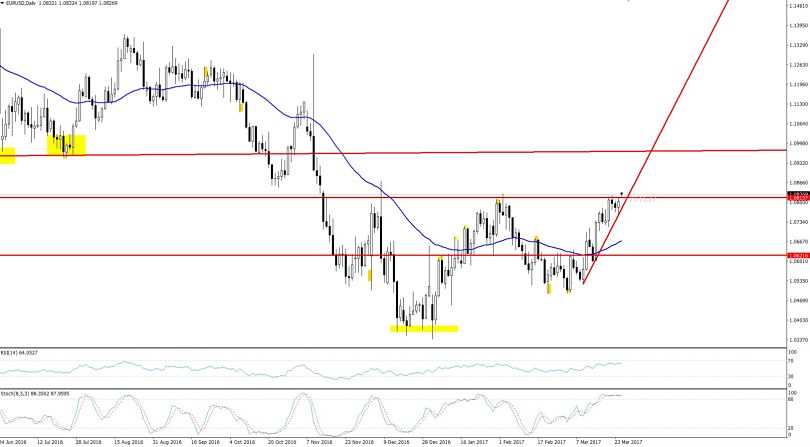
EURUSD – Daily Chart
Technical Outlook- Weekly
The EUR/USD has finally broken above a major double top resistance level at $1.0815. That's the same level we discussed many times in previous morning briefs. Now, the pair is consolidating at $1.0844, right above a major resistance support level at $1.0815.
Moreover, the pair has violated an ascending triangle pattern in the 4-hour chart which indicates that we may see more buyers coming in to increase the demand for a major currency pair this week. The RSI is bullish at 68 along with the 50 periods EMA, which is proving to be an additional support for the pair.
In my opinion, EUS/USD is likely to trade bullish this week, with a potential target of $1.0960. This is due to the $1.0815 trading level. If it proves to be a fake-out level today or tomorrow then we may see the EUR/USD pair falling towards $1.0787.
GBP/USD – Article 50 of Lisbon Treaty
The GBP/USD rose over the last week, setting a weekly high at $1.2531. Yet, the bullishness of the pound wasn't a surprise. The advance was sparked by extraordinary inflations figures caused by pressure put on the Bank of England to raise interest rates sooner than expected. The U.K inflation rose by 0.7% in the month of February compared with the expected 0.5%. Whereas, the yearly rate increased from 1.8% to 2.3%.
Our major focus this week will be the triggering of Article 50 of Brexit on Wednesday, March 29th. Sellers are approaching the day with the intention to enter sell potions. Hence, I am expecting a short squeeze over the near term, perhaps even a sharp dip in prices, and then recovery.
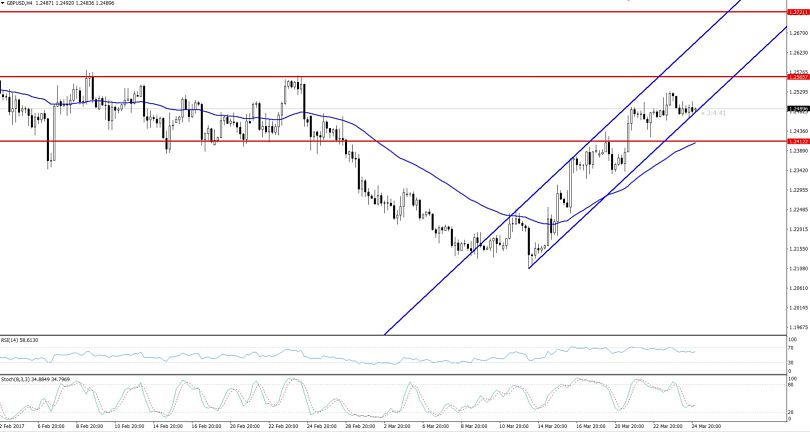
GBPUSD – 4 Hours Chart
Technical Outlook- Weekly
In the daily timeframe, the GBP/USD trades strongly bullish at $1.2520. We can see in the above chart, that it has maintained a bullish channel which is extending the pair a support at $1.2475 along with an EMA support at $1.2415. The Stochastics and RSI are also spreading a bullish bias. In addition to this, we can see an ascending triangle pattern in the 4- hour timeframe.
Thus, a move above $1.2565 would result in a breakout from the bullish triangle pattern that has formed in the past couple of weeks. I can't recommend any long term predictions since we have a heading towards 29th March.
AUD/USD – The Gold Correlated Currency Pair
The Aussie exhibited a strange behavior over the previous week. The Australian dollar remained weak, which was unusual, after a strong performance by the precious metal Gold, and a weakness in the U.S dollar index.
Thus, I'm expecting another dead week for the AUD/USD since we are not expecting any major event from the Australian economy. But, we have to monitor events from the U.S, particularly, the GDP and the jobless claims releasing this week.
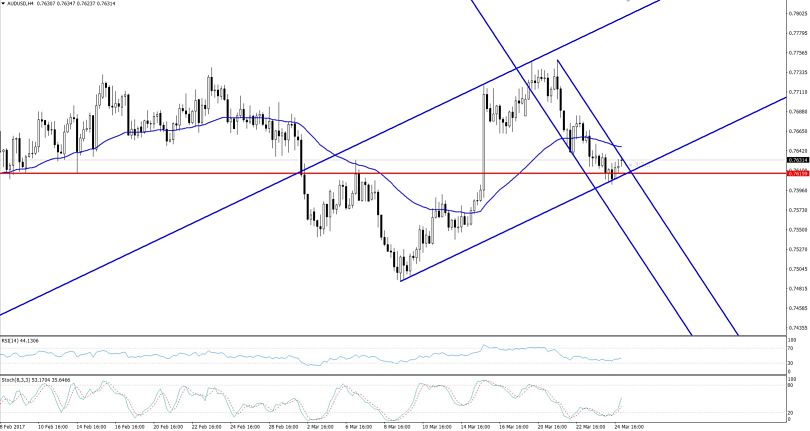
AUDUSD – 4 Hours Chart
Technical Outlook – Weekly
Looking at the daily chart, the AUD/USD has maintained a bullish channel, along with a minor bearish channel. The main bullish channel is extending support at $0.7615 and that's the key level for this week.
Let's talk about support and resistance; a strong support zone is seen in the pair between $0.7590 and $0.7615. On the other hand, the upside resistance is seen at $0.7646 and $0.7670.
I would recommend keeping a close eye on the crucial trading level of $0.7615 because we can take up a buying position above this with a target level of $0.7675. Whereas, a break below this level will give us a sell trade until an initial target of $0.7551.
WTI Crude Oil – Another Bearish Week
Over the previous week, the oil prices ended lower with a slight bounce on the weekly low of $47/barrel. For now, it's consolidating in a narrow trading range with a lower boundary of $47 and an upper boundary of $49.50
This week, we have to follow the OPEC and non-OPEC ministerial meeting and they are likely to talk about cutting the oil production in order to support falling prices. They have been cutting oil out since 2016 but let's see if we get any additional clues as to their next actions.
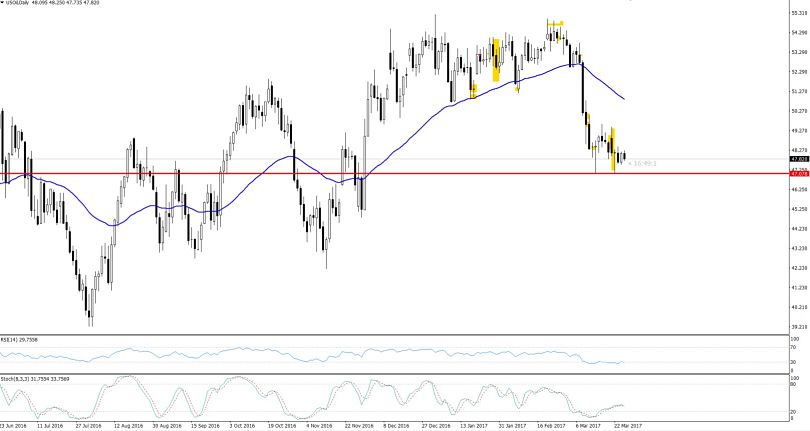
WTI Crude Oil – 4 Hours Chart
Technical Outlook- Weekly
As we know, the crude oil is the most unpredictable instrument because of its high sensitivity towards supply and demand news. This is why the long-term technicals often disappoint. But, let me highlight some key trading levels for you.
Looking at the daily chart, the first support is at a new low, placed at $47.07/barrel. This week, a drop beneath this level is likely to push the market at $45.75. Whereas, on the upside, a resistance is seen at $49.50/barrel with the 2nd resistance at $52.
Lastly, investors should monitor the crude oil inventories that are due to be released on Wednesday at 14:30 GMT.
- Check out our free forex signals
- Follow the top economic events on FX Leaders economic calendar
- Trade better, discover more Forex Trading Strategies
- Open a FREE Trading Account
- Read our latest reviews on: Avatrade, Exness, HFM and XM
Related Articles


Sidebar rates
Related Posts
