Finally A Breakout In The Gold – What’s Next?
The yellow metal Gold finally decided to break out of its well-maintained trading range of $1248 – $1260. This is what we discussed in our previous update entitled Mixed Sentiments Are Taking Gold Nowhere.
Today in the early Asian session, the Gold hit a 10 days low at $1240.36 due to increased demand for the greenback. As we discussed in our 31st of March Morning Brief, the strength of the U.S dollar index was mainly caused by a number of favorable economic events.
Specifically, the U.S gross domestic products (GDP), as well as hawkish remarks from FOMC member Kaplan, successfully extended some support to the greenback. About Kaplan's statements; a quicker movement of policy normalization will probably be required with the Fed fund rate hikes for the year 2017 in order to stabilize the overheating economy.
Due to the negative correlation with the dollar, the Gold dipped over diminishing demand for haven assets.
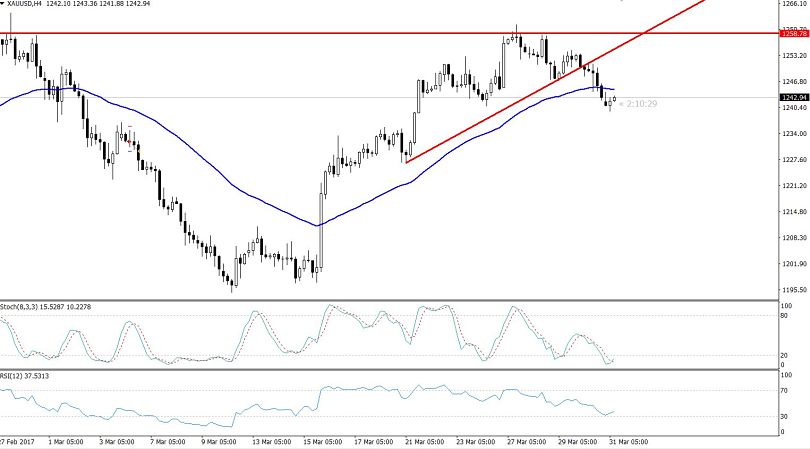
 Gold 4 – Hours Chart
Technical Outlook
Besides for the breakout of its trading range, the Gold slipped below a strong trendline support of $1250. In the 4- hour chart, we can see bearish crossover not only in the RSI but also in the 50 periods EMA.
At this moment, the Gold prices are holding below a strong resistance level of $1246. On the other hand, sellers are going to find a support at $1238 and $1234.
Trading Signal: Fellows, we unfortunately missed a trading opportunity overnight. However, I'm looking to enter a sell position on an upside pullback below $1246 with a stop loss of $1249 and a take profit of $1238.
We need to keep an eye on U.S economic events, as the negative figures may extend a support to the weaker Gold prices.


 Gold 4 – Hours Chart


