A Bullish Breakout In The Nikkei – Eurozone In Focus
The Japanese stock market index Nikkei opened with a huge gap of nearly 345 points similar to the gap we saw in the Euro currency pair. This makes sense as both are caused by the same reason, Macron's victory in the first round of the French elections.
Over the past few days, the global stocks traded lower due to uncertainties around the globe. However, the markets recovered all the losses in one go. The U.S stock market indices such as S&P 500 gained 1.1% and rose to $2374. The Nasdaq surged 1.2% to $5983.82, achieving a new all-time high. Likewise, the Nikkei index, which follows in the footsteps of the U.S stock markets, made its way up to a multi-week high of $19100 today.
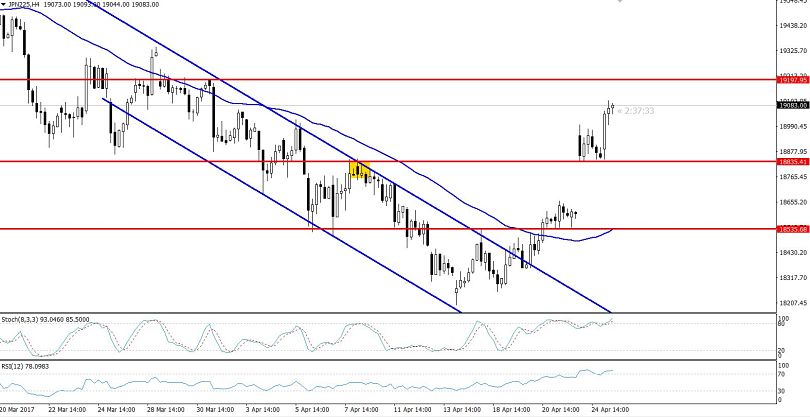
 Nikkei – 4 Hours Chart
Technical Outlook – Intraday
Technically, the index is presenting a strong bullish trend. It broke above a major resistance level of $18995. The index has formed the "three white crows" candlestick pattern in the hourly timeframe which demonstrates that the bullish trend has just begun.
Moreover, the RSI has entered into the overbought territory (above 70) which is demonstrating that investors' have a buying sentiment. The commodities and indices often ignore the overbought and oversold signals from the RSI and continue trading in their trends.
Forex Trading Signal
Taking the technical analysis into account, I decided to open a buy position above $1900 with a stop loss of $18900 and a take profit of $19150. At the movement, the market is very close to hitting our take profit level. I recommend you all drag your stop loss into positive territory to avoid any sudden reversals.
- Check out our free forex signals
- Follow the top economic events on FX Leaders economic calendar
- Trade better, discover more Forex Trading Strategies
- Open a FREE Trading Account


