WTI Crude Oil Completes Retracement – Inventories Ahead
Yesterday, the crude oil plunged sharply to hit our stop loss. However, later the market traded exactly as forecasted in our previous update, Quick Reversal In The WTI Crude Oil.
Early this morning, the crude oil prices plunged bitterly ahead of the release of the inventories figures. This is because investors are still concerned about the gaining output as it continues to weigh on the oil prices.
The Libyan issue is also still bothering investors. Yesterday, Libya boosted oversupply concerns as their production bounced to the highest levels since 2014.
Lastly, the API (American Petroleum Institute) released inventory data, emphasizing a drag of 4.16 million barrels. Whereas, the previous week's draw was only 0.9 million barrels. This figure gives a bullish support to oil prices and we can expect a major drop in inventories from the EIA as well.
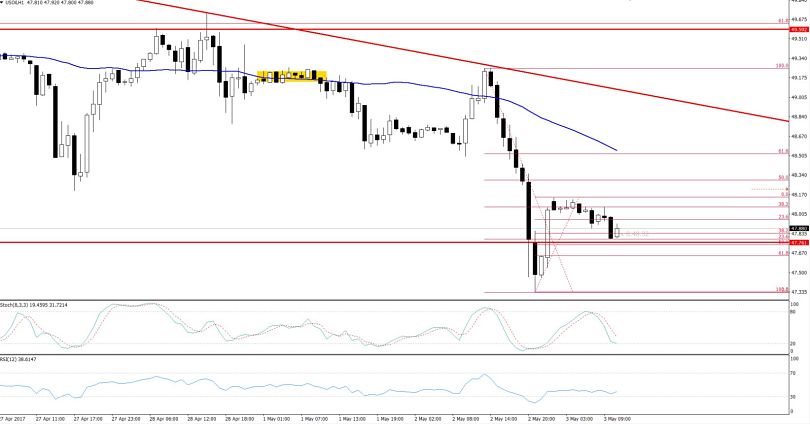
 Crude Oil Fibonacci Retracement – Hourly Chart
Technical Outlook – Intraday
In the hourly chart, we can see that the oil was trading in the oversold territory after yesterday's drop. However, it has completed a 38.2% Fibonacci retracement at $48.15 and it seems ready for further selling. Moreover, the 50 periods EMA and the momentum indicator RSI are also suggesting a selling bias for the commodity.
At this point, the crude oil is facing its nearest resistance at $48.15 and $48.55. Its support can be found at $47.75 & $47.20.
Forex Trading Signal
Based on the technicals, I have opened a sell position below $48, with a stop loss of $48.25, and a take profit at $47.72. At this moment, our trading signal is holding in the 18 pips profit. I recommend that investors drag their stops at breakeven points.
- Check out our free forex signals
- Follow the top economic events on FX Leaders economic calendar
- Trade better, discover more Forex Trading Strategies
- Open a FREE Trading Account
