3 Technical Indicators Signalling An AUD/USD Trade


AUD/USD has been in a decent uptrend since it bottomed out about two weeks ago. We haven´t had a lot of buy signals during this time, probably only one. But as you can see on the H4 forex chart, that´s because the bigger trend is still down, so we didn´t against it.
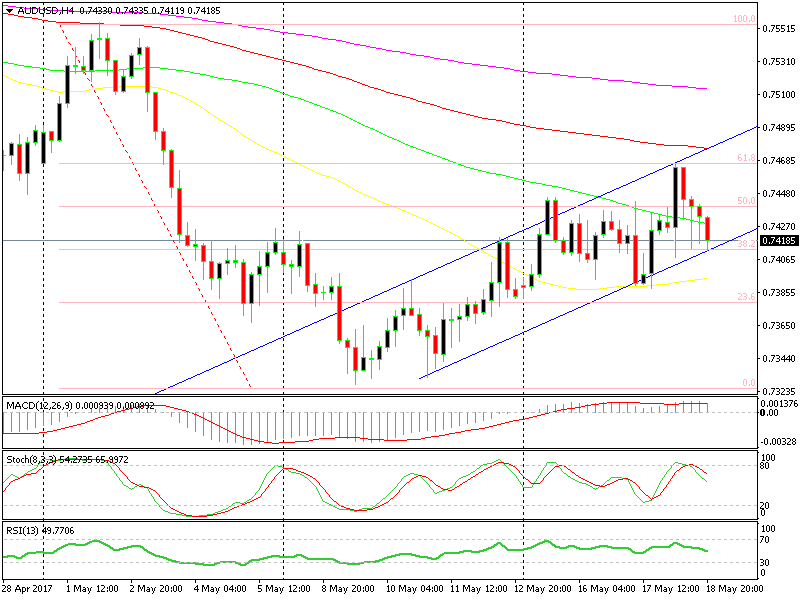 The trendline is providing support
Although, we could have made more of if, which we are trying to do now. The uptrend channel is very visible and we are just above the lower trendline. That´s one technical indicator signalling us to go long, at least with a short term forex signal.
Another indicator is the Fibonacci retracement levels. The price is sitting on the 38.2% retracement level at the moment, which is considered as medium when it comes to strength.
So, that makes it 2 indicators pointing up but there´s more to come. If we switch to the hourly chart, we see the 100 SMA (red) providing support.
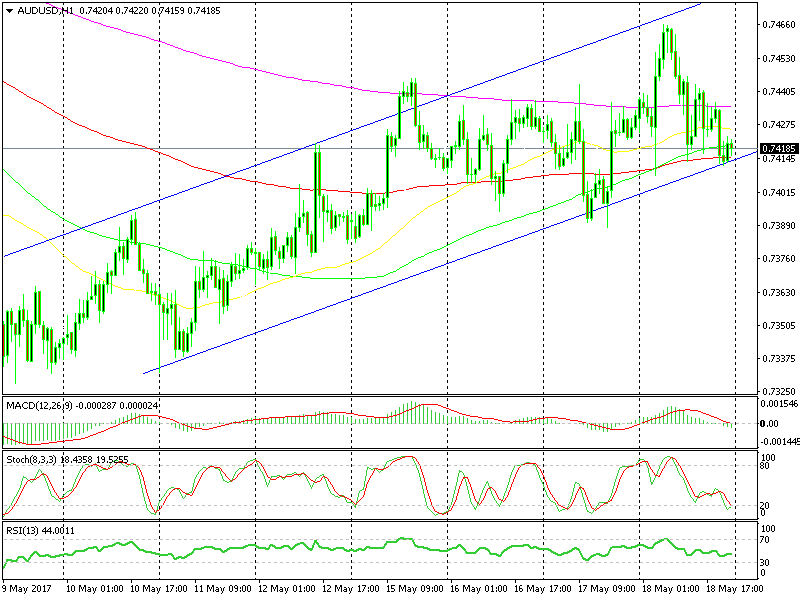 The 100 SMA is also providing support
So, there goes the third technical signal suggesting to open a short term forex signal. There´s, of course, the daily chart which is pointing down since the daily candlestick closed as an upside down hammer, as well as being oversold.
But, this is forex, we take our chances and the smaller timeframe charts are pointing up, hence the short term buy fx signals, one of which we just opened by the way.