The Range Is Moving Lower In GBP/USD
At first, the trading range in GBP/USD was between 1.30 and 1.2840-50, but then the 1.30 level finally broke last week and the range shifted higher to 1.2950 – 1.3050.
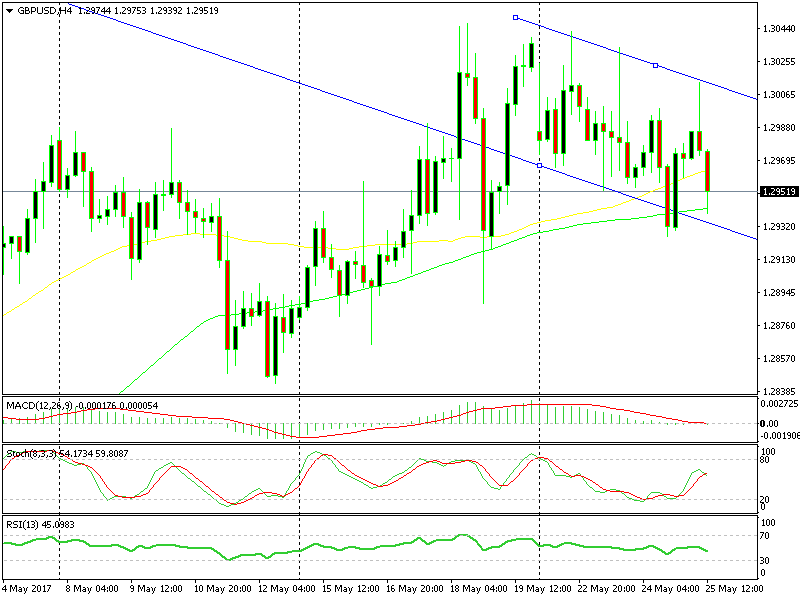
So, the 1.3040 has now turned into resistance, but we see, on the H4 forex chart, that the range has been sliding lower since touching 1.3050 about a week ago.
The range is slipping lower
I mentioned in one of the updates a few days ago that I would try to sell this forex pair at 1.3040-50, but it never reached those levels since the start of the week. In fact, the top of the range has been sliding slowly and today that range is around 1.3015.
The bottom of the range has also shifted lower and is now around 1.2935, only a few pips below today´s low. The UK economic data must have also played a role on this morning´s swift reverse. Business investment doubled in the first quarter which is a positive signal, but services and most importantly the GDP missed expectations.
At 0.2%, the quarterly UK GDP stands a long way away from the numbers we saw last quarter, which came at 0.7%. That´s obviously not a good signal for the UK economy and with Brexit looming, the picture seems a lot darker.
You see that we have touched the 100 SMA (green), which stands just below the lower trendline of the ascending channel but if feels dangerous going long right now.
I would prefer going short near the top of the range, probably around 1.3000-10. So, we´re waiting for the price to move up there before pulling the trigger.
- Check out our free forex signals
- Follow the top economic events on FX Leaders economic calendar
- Trade better, discover more Forex Trading Strategies
- Open a FREE Trading Account
- Read our latest reviews on: Avatrade, Exness, HFM and XM
Related Articles


Sidebar rates
Related Posts
