Forex Signals Brief for June 6th – Bears Dominates The Buck, Technical Levels In Focus
In the early Asian trading sessions, the U.S. dollar index fell sharply against the other currencies, perhaps, due to the release of unfavorable fundamentals from the United States. However, on Monday, most of the investors "priced In" the phenomenal U.S. unemployment rate of 4.3% and this helped the buck gain support in the market.
The hiked uncertainties in the global markets encouraged investors to switch to the gold, rather than rely on the U.S. dollar. Demand for haven appeal hiked after this weekend's terror attack in London. The attack killed seven after a van drove into walkers on the London Bridge. Later, the attackers began to kill people at nearby restaurants.
Additionally, the macroeconomic events were not in support of the bullish U.S. dollar. We are going to talk about these events in the next section in more detail. Overall, to talk about the forex trading signal, the day began with a stop loss in gold, but ended with take profits in the WTI Crude Oil & USD/CAD.
Top Economic Events To Watch Today
JPY
- 30-y Bond Auction (3:45)
AUD
- RBA Rate Statement (4:30)
- Cash Rate (4:30)
- AIG Construction Index (23:30)
EUR
- Retail PMI (8:10)
- Sentix Investor Confidence (8:30)
- Retail Sales m/m (9:00)
CAD
- Ivey PMI (14:00)
USD
- JOLTS Job Openings (14:00)
- IBD/TIPP Economic Optimism (14:00)
EUR/USD – Bulls Dominated Currency Pair
On Monday, the EUR/USD retraced back a part of its gains which it made over Friday, primarily, due to a weaker than anticipated U.S. labor market report.
Today, the Bulls appeared in the market in the Asian session, ignoring the bearish bias investors formed on Monday. The overall outlook for the major currency pair EUR/USD remains positive, given the technical changes and price action which has taken place over the previous couple of sessions.
Forex Trading Signal – Idea
Traders, $1.1285 is a crucial trading level for the day. I will be looking to add a buying position only above this level to target $1.1325. On the flip side, keeping a sell position below $1.1285 could also be a good idea.
 EUR/USD – Hourly Chart
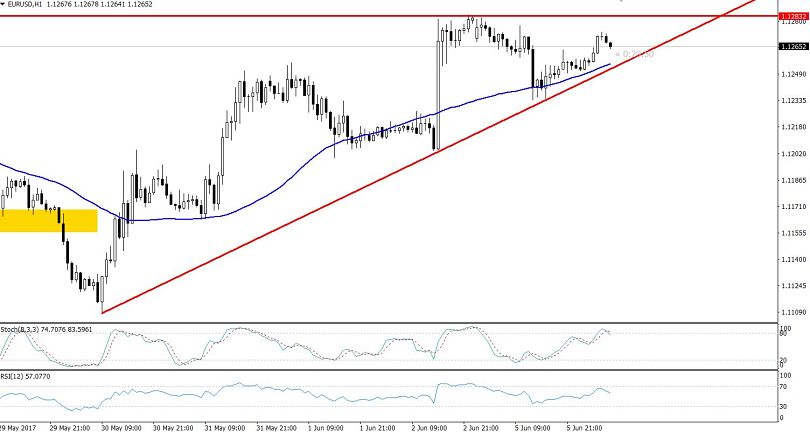
Technical Outlook- Intraday
On the hourly chart, the EUR/USD has formed an ascending triangle pattern which is extending a strong support somewhere around $1.1250, along with a resistance at $1.1282. Ascending triangle patterns accompany a bullish breakout sentiment.
Having said that, we can also see in the weekly chart, the EUR/USD plunged dramatically in the first week of June and formed a bullish engulfing candlestick pattern. This demonstrates investors' intentions to stay on the buying side.
USD/JPY – Double Bottom Breakout
As discussed in our update Forex Signals Brief For June 5th – 11th, the USD/JPY was one of the major movers in the market. It continues to trade bearish today due to consistent downward pressure caused by the weaker U.S. fundamentals and boosted demand for haven assets. This week began with a USD/JPY bearish sentiment over the news of another missile test by the North Korea.
Aside from this, the Japanese Yen caught a bid tone in the early Asian session following Japan’s labor cash earnings, which reported a four-month high. Higher inflation is a good signal for the economy and it develops the sentiment that the BOJ may increase the interest rates in the future. Though, we aren't expecting such aggressive action that early, investors are likely to trade USD/JPY using this sort of thinking.
Forex Trading Signal – Idea
USD/JPY is already trading at $109.700, and that's the significant trading level to watch. If the pair manages to stay above this level, we need to enter a buying position to target $110.280. Alternatively, below $109.700, sellers are likely to target $109.320.
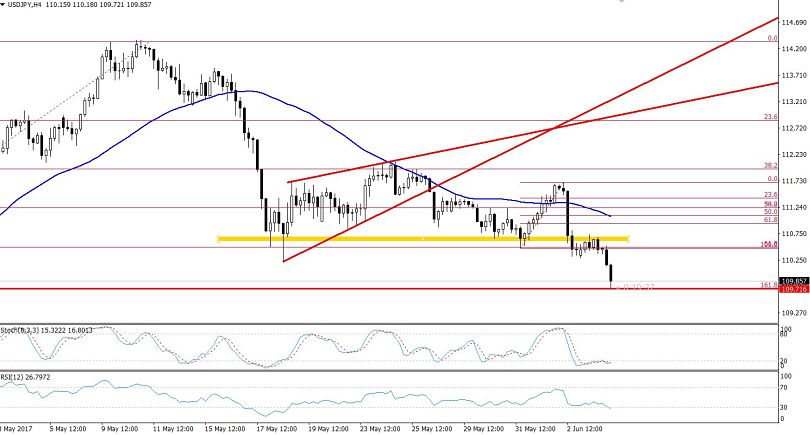
USD/JPY – 4-Hour Chart
Technical Outlook- Intraday
Most of the technical tools are indicating investors' bearish sentiments. Looking at the 4-hour chart, the USD/JPY is trading below a 50- periods moving average which is extending a strong resistance at $110.600. The prices below the moving average indicate that investors are more interested in keeping the USD/JPY in selling.
Most importantly, the pair dropped below the double bottom support level of $110.560 to hit our weekly target level of $109.750, as suggested in Forex Signals Brief For June 5th – 11th.
For now, we need to keep a close eye on $109.700 as it can give us our fresh entry in the market.
Ending Remarks
Honestly speaking, today the fundamentals don't seem to have much potential to extend new trends. Thus, I would suggest trading the technical levels today. I recommend that investors monitor the RBA (Reserve Bank Australia) in the Asian sessions today to trade the Australian currency pairs. Investors should also plan to focus on the ECB meeting later this week.
- Check out our free forex signals
- Follow the top economic events on FX Leaders economic calendar
- Trade better, discover more Forex Trading Strategies
- Open a FREE Trading Account
- Read our latest reviews on: Avatrade, Exness, HFM and XM
Related Articles

Sidebar rates
Related Posts
