A Deadly Dip In WTI Crude Oil – What’s Going On?
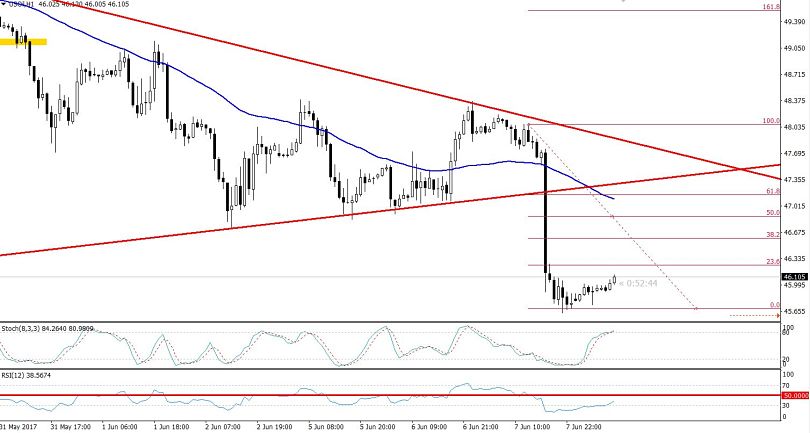
The crude oil exhibited a crazy price action in the New York session yesterday. It fell more than 150 pips in less than a 15 min. time span. This was definitely painful for the bears, but buyers must have felt the pain as well.
In the European trading session on Wednesday, we shared a forex trading signal to have a buy position on the technical breakout in the symmetric triangle pattern. However, the later breakout proved to be a fakeout upon the release of crude oil inventories.
The black gold, crude oil came under heavy selling pressure after the Energy Information Administration (EIA) reported a build of 3.29 million barrels over the previous week (ending on June 2nd). The figure was quite shocking as the build in inventories was followed by a draw of 6.43 million barrels, which resulted in a lesser demand sentiment.
Forex Trading Signal – Idea
Considering the technical scenario, we have shared a buying call above $46, with a stop loss below 45.6 and a take profit of $46.35. On the flip side, it is also possible to have a sell position below $45.70.
 WTI Crude Oil – Hourly Chart
Technical Outlook – Intraday
Looking at the 4-hour chart, the WTI crude oil is trading in the oversold region. The RSI and Stochastics are trading at 29 & 13 respectively, demonstrating that it's time to expect profit taking in the commodity.
Additionally, we can see a huge gap between candlesticks and the 50-periods EMA, which represents that the prices are far away from the technical value.
- Check out our free forex signals
- Follow the top economic events on FX Leaders economic calendar
- Trade better, discover more Forex Trading Strategies
- Open a FREE Trading Account
 WTI Crude Oil – Hourly Chart

