Let’s Trade A Triple Bottom – Potential Trade Idea In Gold
On Monday, the precious metal continued to trade bearish for the 4th consecutive trading day at $1263 merely due to the back of growing demand for the US dollar. However, later in the New York session, the weakness in the equity market underpinned the demand for haven assets, but only to a limited extent.
However, the situation is totally different now. The gold prices are barely moving in anticipation of the FED (Federal Reserve) decisions ahead. The Federal Open Market Committee (FOMC) will presumably lift its benchmark rate from 1% to 1.25% on Wednesday.
But, In my opinion, most of the interest rate hike sentiment is already "priced in" and now the investors are waiting for the actual fact. Today, the game is in the technical analysis court thus let's have a real quick look at the technical side of the market.
Forex Trading Signal – Idea
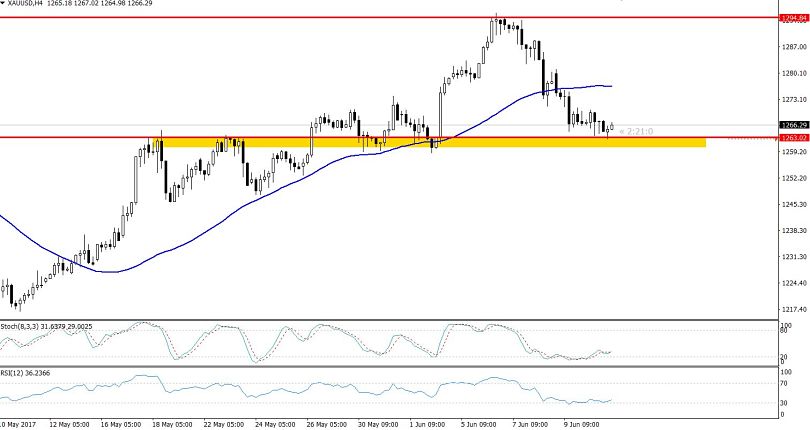
Today, I'm focusing on the $1262, a crucial trading level. I also recommend taking a buy entry above with a minor stop loss of $1259 and a take profit of $1270/71.
On the flip side, sell positions only seem suitable below $1262, with a take profit of $1256.
 Gold 4-Hour Chart – Triple Bottom Pattern
Technical Outlook – Intraday
Firstly, we can see a triple bottom pattern on the 4-hour chart which is extending a solid support at $1262. More specifically, the precious metal has also formed a test bar right above the support level, signaling investors' strong sentiment to catch the retrace.
In addition, the 50- periods EMA is supporting traders' selling sentiment. The leading indicators, including the Stochastic and the RSI, and the metal has entered the oversold region. That's why we need to focus on the $1262. It’s the crucial trading level today and the breakage of this particular level will determine the market's further trends.
- Check out our free forex signals
- Follow the top economic events on FX Leaders economic calendar
- Trade better, discover more Forex Trading Strategies
- Open a FREE Trading Account


