Contradicting Charts In USD/JPY, But We Can Still Trade Them
I was planning to go to the beach this weekend but temperatures fell again so it was a pretty boring weekend. Having nothing to do, I scanned some charts and after looking at the daily chart of USD/JPY, I noticed that this forex pair has been trading in a downtrend since the start of the year.
There have been a few pullbacks but the downtrend has remained intact. In fact, right now the price is just below the ascending trendline after failing to break it on Friday. On Friday, the upward momentum continued from the previous day, but the price reversed right after touching the trendline.
 The descending trendline seems to be working again
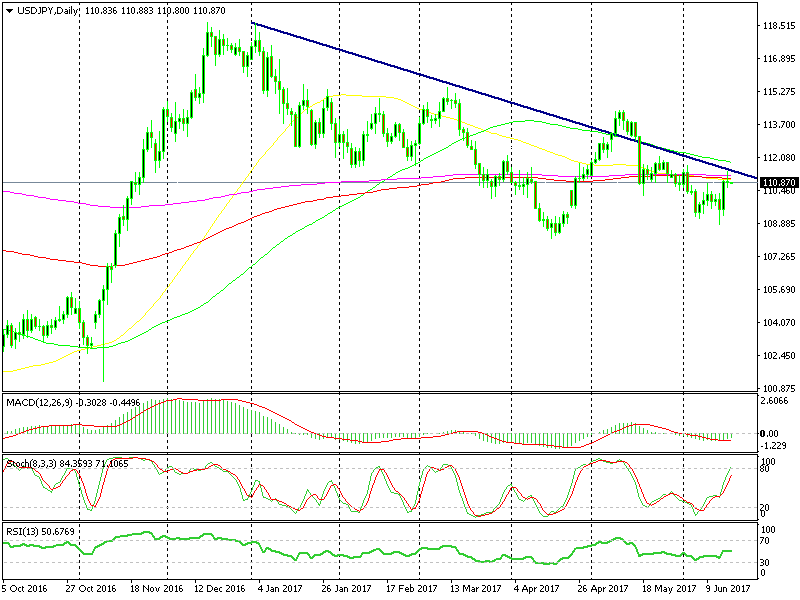
The daily candlestick closed as an upside down pin, which is a reversing signal. A number of moving averages are positioned above there and the stochastic is almost overbought. So, we might see a continuation of the downtrend in the following days.
On the other hand, the weekly chart is pointing upward. We can see that the 50 SMA (yellow) and the 100 SMA (red) have been providing solid support several times this year and I don’t think it will go anytime soon. So that leaves us with only one option, up.
On the contrary, the weekly chart formation is pointing up
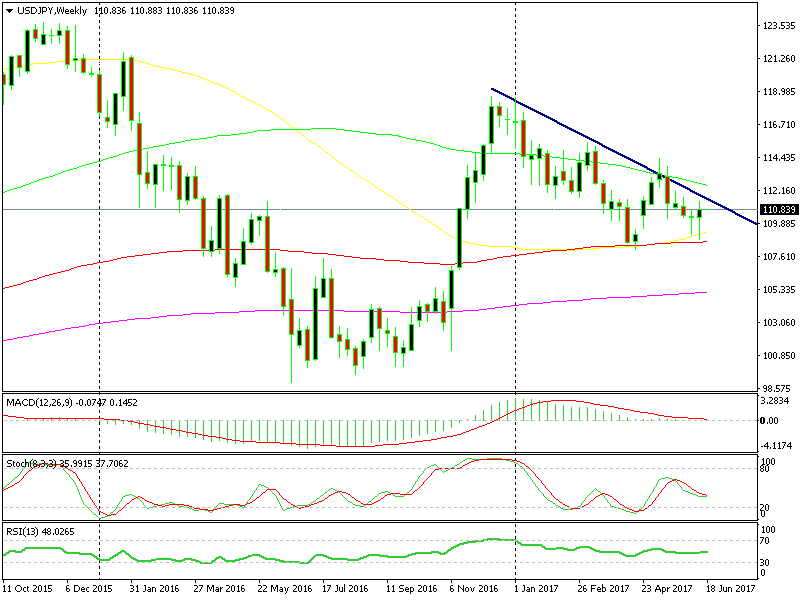
But it´s not only the moving averages which point up, the last 2 weekly candlesticks closed as a doji and as a hammer, which are reversing signal. But, this time the reverse is in the opposite direction compared to the daily forex chart.
So, what do you make of these two chart setups?
The logic tells us that we will see a continuation of the downtrend in the daily chart until we reach the 2 moving averages and fail once again. Then, the weekly chart takes charge and this pair moves 400-500 pip higher.
But, don’t forget that the FED turned hawkish on Wednesday, so the fundamental picture is a lot better for the dollar. This means that we might not even meet the 2 moving averages again, in my opinion.
So, we will wait for this pair to become oversold on the H4 chart instead of the daily chart, before opening a long term buy forex signal. That will probably be around 1.1020-30, which we might reach today.
- Check out our free forex signals
- Follow the top economic events on FX Leaders economic calendar
- Trade better, discover more Forex Trading Strategies
- Open a FREE Trading Account


