61.8% Fib Retracement In The Gold – FOMC Fischer Ahead…
The yellow metal gold has continued to trade bearishly after testing $1296 in the first week of June. Yesterday, the metal started trading within a narrow trading range. However, the comparatively hawkish remarks from Fed member Dudley triggered a return of the selling trend in the gold.
FOMC member and head of the New York Federal Reserve, Bill Dudley played down the slowdown in inflation (CPI). To quote Dudley, "we are pretty close to full employment. Inflation is a little lower than what we would like, but we think that if the labor market continues to tighten, wages will gradually pick up and with that, inflation will gradually get back to 2 percent"
This clearly shows Dudley's hawkish sentiment. As a result, investors shifted to equities and the US dollar, while lowering the demand for haven assets such as gold, silver, and Japanese Yen. Let's take a look at the rough trading idea for today.
Forex Trading Signal – Idea
In the early European session, I shared a forex trading signal to open a buy position above $1245, in order to target $1249 with a stop loss below $1242.
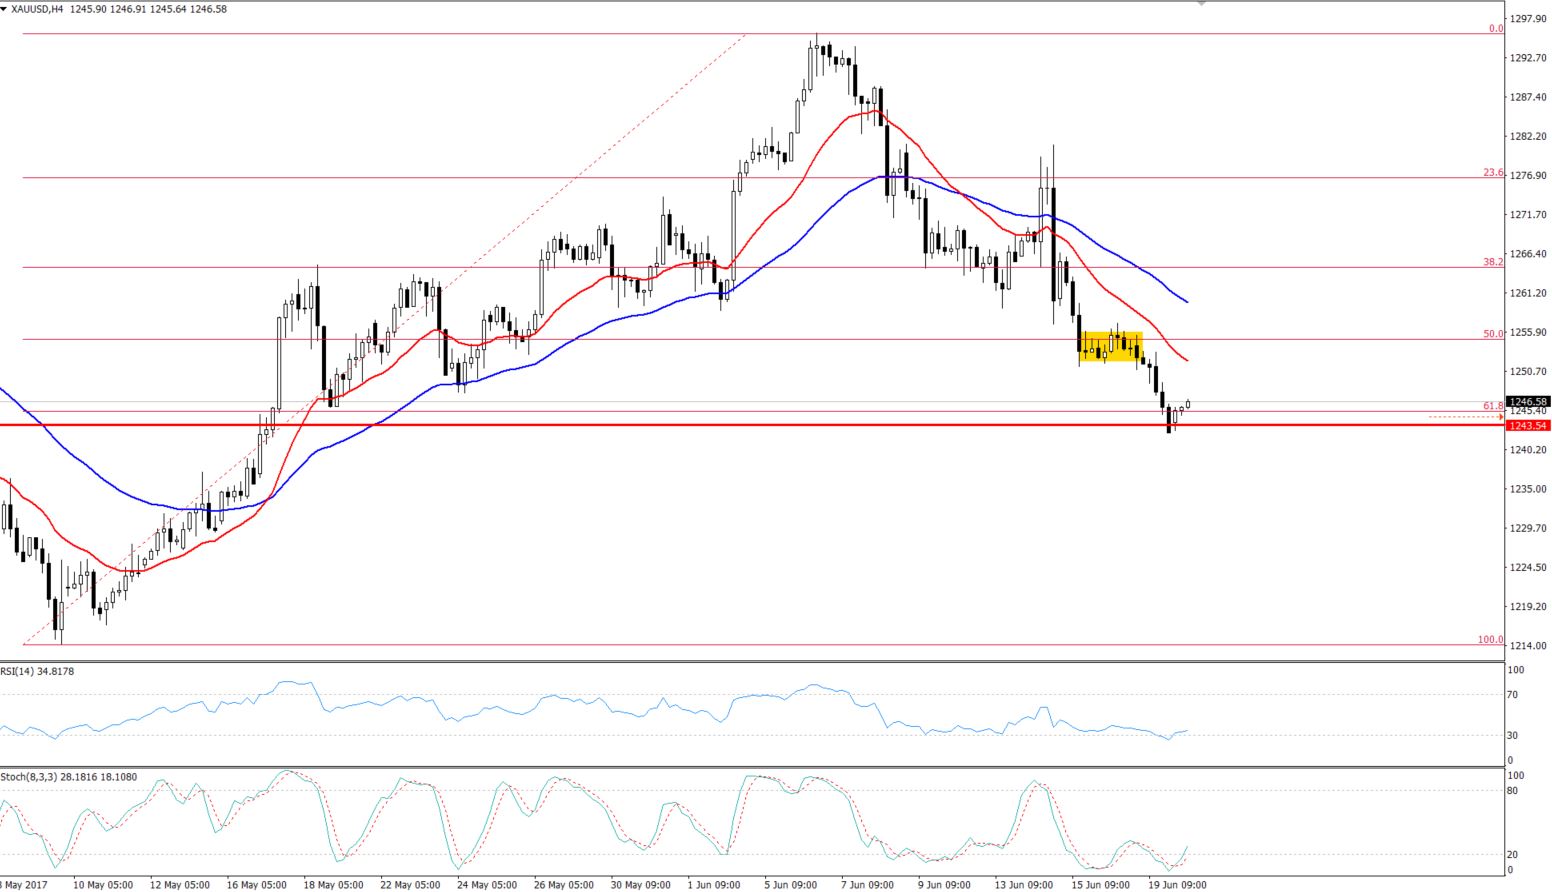
 Gold – 61.8% Fibonacci Retracement – 4- Hours Chart
Technical Outlook – Intraday
The technical side of the gold is heavily bearish. For example, looking at the 4 – hour chart, the gold is trading below 20 & 50 periods EMA, signifying a bearish trend in the gold.
On the daily chart though, the precious metal has completed 61.8% Fibonacci retracement which is extending a strong support at $1243 to the fundamentally bearish gold.
In the meantime, the RSI & Stochastic have entered the oversold region, which emphasizes that sellers are exhausted and they may try to make a profit by closing their sell positions. Therefore, we have entered on the buying side to try and catch the retracement. Even though it's anti-trend trade, it's worth the risk.
- Check out our free forex signals
- Follow the top economic events on FX Leaders economic calendar
- Trade better, discover more Forex Trading Strategies
- Open a FREE Trading Account


