Dumping Demand & Increased Output- WTI Crude Oil In Trouble!
Early morning gaps in the market are often caused by a significant fundamental reason. The WTI crude oil began trading with a bullish gap of nearly 31 pips. The black gold closed at $44 on Monday and opened at $44.310 on Tuesday.
The major reason behind the bullish gap is the initial estimates of the API (American Petroleum Institute) which expect a decline of 2.180 million barrels of crude oil inventories.
Just like EIA (most important), the American Petroleum Institute (second most important) also released its weekly inventory figures after the close of the US market. The data is followed by figures from the Energy Information Administration (EIA), which are due to be released on Wednesday.
Forex Trading Signal – Idea
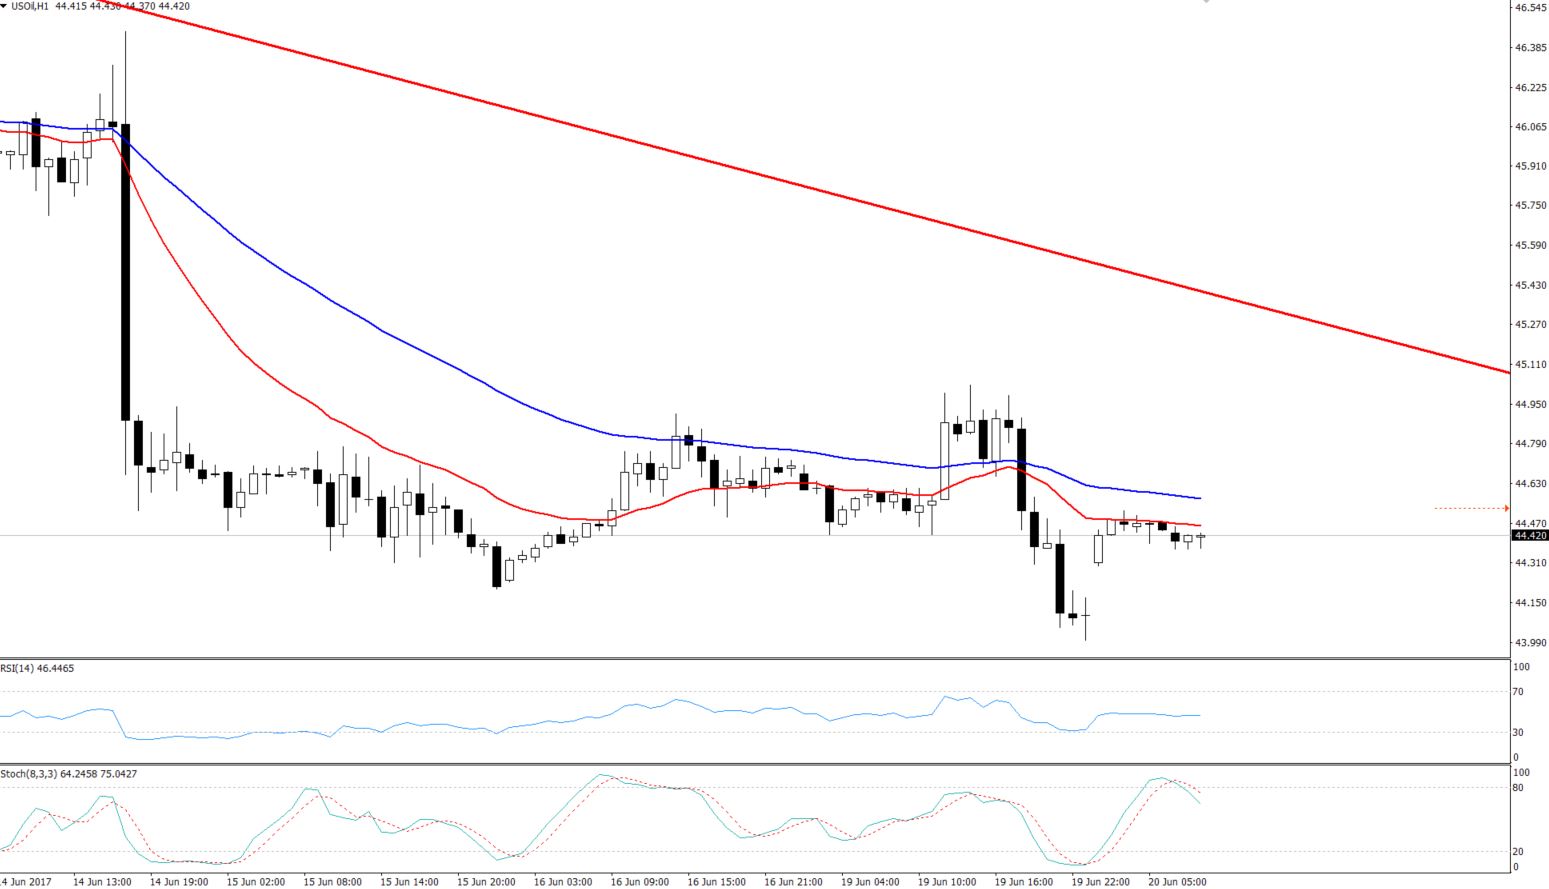
Investors are recommended to focus on $44.35 as below this the market is likely to target $44.10. On the other hand, I will be looking to enter a buying position only above $44.60 with the intention to target $45.10.
 WTI Crude Oil – Hourly Chart
Technical Outlook – Intraday
Let me break down the facts for review:
- On the hourly chart, we can see the oil is trading below the 20 & 50 periods moving averages. For advice on a moving average strategy, refer to the article here.
- The momentum indicator RSI is slightly bearish, whereas, the stochastic is coming out of the overbought zone.
- The energy instrument has opened with a gap, which technically needs to be closed by today, tomorrow or in the upcoming days.
Overall, the technical outlook for the crude oil is slightly bearish. However, we need to wait for the API figures in order to gain a clear idea about the trend.
- Check out our free forex signals
- Follow the top economic events on FX Leaders economic calendar
- Trade better, discover more Forex Trading Strategies
- Open a FREE Trading Account


