Forex Signals Brief for June 21st – 5 Things To Watch Out For Today
The market hasn't been very volatile in the Asian & European sessions. Yet, there is a lot of movement happening in the US sessions. It seems like Asian investors are reluctant to enter the market before the release of the FOMC & Fed Fund Rate. However, the dollar managed to maintain bullish momentum for the second straight day. The greenback remained positive because of the upbeat remarks from the Fed (Federal Reserve). Additionally, the drop in the sterling gave the US dollar more upside momentum.
Our forex trading signals in the currencies were successful. However, we remained unlucky with the gold and WTI Crude Oil. Both of our signals floated in green pips for a long period before the US markets opened. Later, the sudden entrance of sellers on fundamentals distorted our analysis. Regardless, the forex trading signal for the Japanese Index, Nikkei, was a good idea.
Daily Highlights:
Comparatively, in the context of the economic events, today is a quiet day. Nonetheless, there are a few events investors are likely to focus on:
- UK – Public Sector Net Borrowing is due to be released at 8:30 (GMT) with a 7.3B forecast, which is lower than the previous figure of 9.6B. This lower figure is likely to strengthen the Pound.
- UK MPC Member Haldane Speaks is due to speak in Yorkshire at 11:00 (GMT). Why should we care about his speech? Because he is a chief economist of the BOE and an MPC member.
- US Existing Home Sales is due to be released at 14:00 (GMT). We are expecting a minor drop from 5.57M to 5.54M. We will see movement if National Association of Realtors surprises us with an unexpected drop or gain.
- US Crude Oil Inventories are scheduled to be released at 14:30 (GMT). EIA (Energy Information Administration) expects a draw of -1.2M which is comparatively lower than the previous weeks draw of -1.7M. API recorded a draw of 2.72 million barrels after the unexpected build of 2.75 million barrels last week. Cross your fingers that the draw is higher this time as well.
- New Zealand Official Cash Rate is expected to be released at 21:00 (GMT) along with the RBNZ Rate Statement. However, RBNZ isn't expected to hold the rate at 1.75%. Any change in the rate is likely to give us our long term position.
EUR/USD – Triple Bottom Breakout
The single currency Euro continues to trade weaker against the buck, however, it's lacking volatility. The major currency pair is confined to the narrow trading range $1.1110 – $1.1285.
Evans, the Chicago Fed President, made a balancing remark when he said it could make sense to hold an additional rate hike before December. In addition, he also explained that that new inflation figures should not prevent balance sheet shrinkage. Regardless, his comments had a muted impact.
Forex Trading Signal – Idea
I'm planning to stick with the same plan, to stay in sell below $1.1140, with a target of $1.1105 & $1.1065.
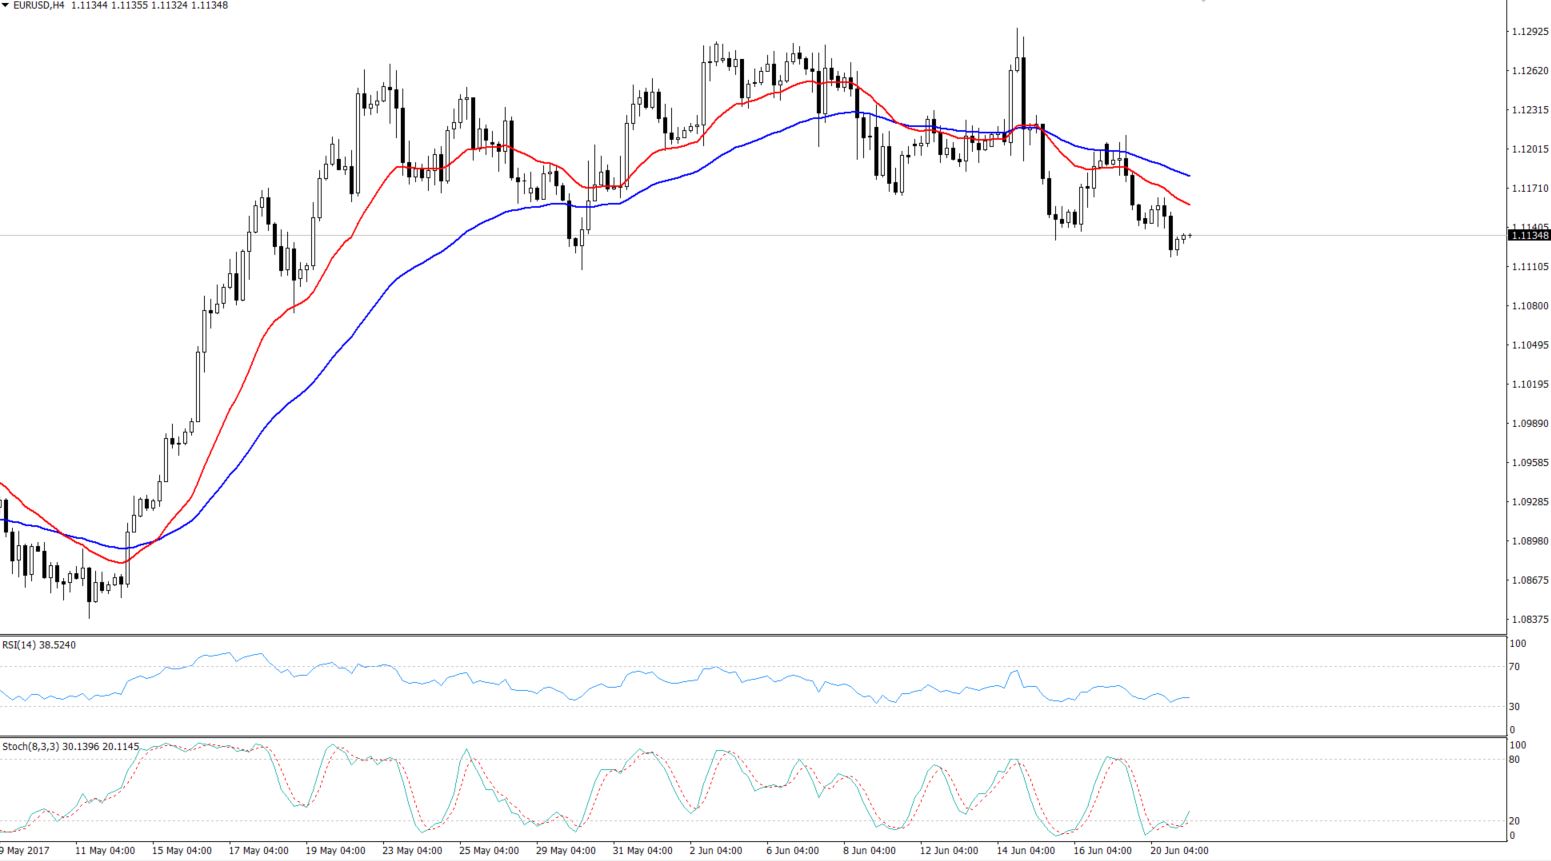 EUR/USD – Triple Bottom Breakout – 4-Hour Chart
Technical Outlook – Intraday
We can see on the 4-hour chart, the EURUSD pair has violated the triple bottom level that we discussed in our previous update, at $1.1140. At the moment, it's consolidating below the support (became a resistance) level.
Looking at the trend indicator, the pair is holding below the 50-periods moving average, indicating investors' bearish sentiment. Refer to our great moving average strategy article here.
For now, the immediate resistance is found at $1.1145 and $1.1185. Whereas, below $1.1135, the market has the potential to target $1.1060.
USD/JPY- The Head & Shoulder Pattern On Play
In contrast to EUR/USD, the Buck traded weaker against the Japanese Yen, perhaps, due to the same technical patterns which we discussed yesterday. On the other hand, if the gold is still trading bearish, this signifies the bears in USD/JPY are lead by head & shoulder pattern, which is further explained below in the technical outlook section.
Today, investors are likely to wait for the All Industries Activity m/m which is due to be released at 4:30 (GMT) with an extremely positive forecast of 1.7%, compared to -0.6% last month. Let's wait for new indicators.
Forex Trading Signal – Idea
As mentioned in our previous update, Forex Signals Brief for June 20th, investors are advised to keep $112 in focus in order to secure today's trade. The rough idea is to have a buy/sell position below or above this level. On the sell side, the target is likely to be $110.960.
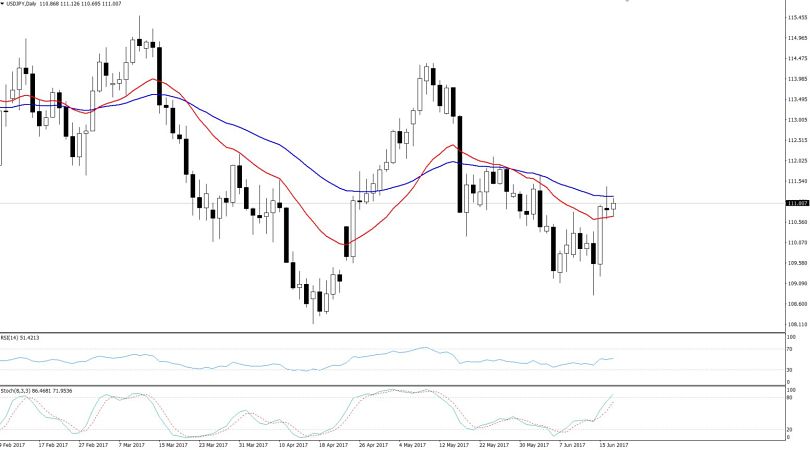
 USD/JPY – Daily Chart
Technical Outlook – Intraday
On the daily chart, the USD/JPY has formed a head and shoulder pattern, which is flagging a possible reversal. The USD/JPY is having a notable resistance at $112.
Since the prices are already holding below $112, we need to monitor $111.250 today. Breakage below $111.250 is likely to drop the market towards $110.850.
Considering the leading and lagging indicators, the pair's trend is somewhat bullish as we had an RSI crossover in daily timeframe. Although, both of the moving averages, 20 & 50 periods are supporting a bullish momentum in the pair.
Ending Remarks
The forex traders are likely waiting for the macroeconomic events from the US economy in order to trigger their trades based on clear trends. Traders are recommended to keep an eye on the Existing Home Sales from the United States & Official Cash Rate from New Zealand.
- Check out our free forex signals
- Follow the top economic events on FX Leaders economic calendar
- Trade better, discover more Forex Trading Strategies
- Open a FREE Trading Account
- Read our latest reviews on: Avatrade, Exness, HFM and XM
Related Articles


Sidebar rates
Related Posts
