Quick Technical View of WTI Crude Oil!
In the latest update, we discussed how 'black crack' has been stuck in a long-term trading range of $43.75 – $46.50 for quite a while. Despite many important economic releases, this commodity is still trading within these levels. The market is confused between an increase in inventory draws and a glut of supplies in the international market.
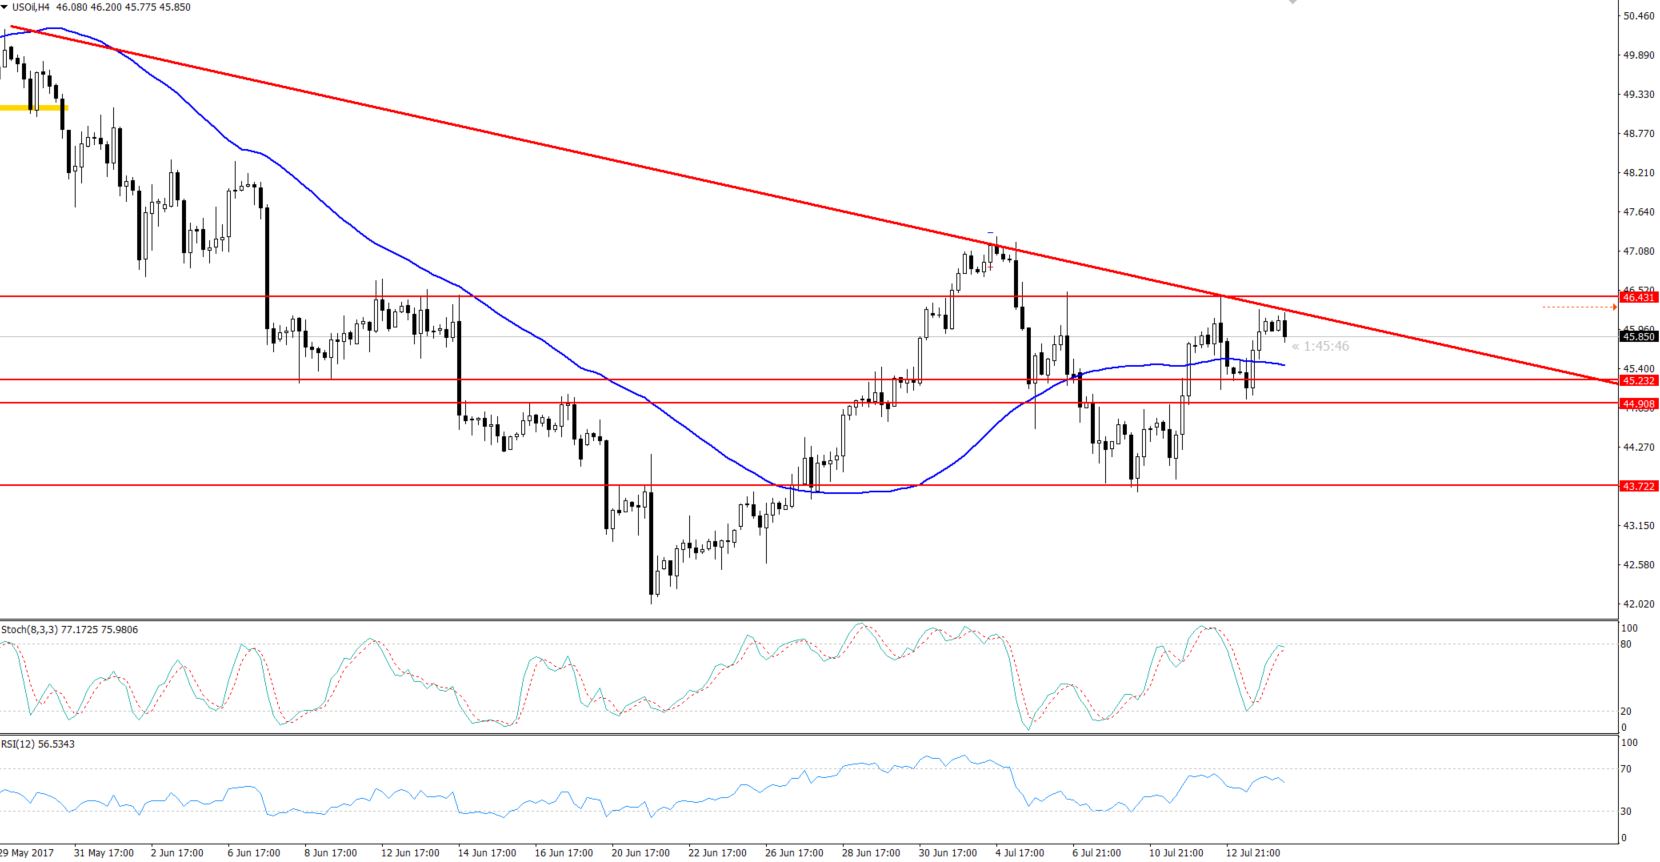 Crude Oil – 4-Hour Chart
Forex Trade Signal Idea
– Traders, I would like to stay on the sell side below $46.30 with a target of $45.30. While, above $46.30, buying will be a good idea to target $46.90.
– Technically, oil has completed a 50% Fibonacci retracement at $44.96 and the same level is now acting as a support.
– The price of WTI crude oil is holding above the 50-period EMA which signals a bullish tone of investors.
– On the 4-hour chart, there is a bearish trendline which is a hurdle at $46.30. Whereas, on the lower side, $45.75 is a key level. In order to get a better understanding of how to profit from a support and resistance trading strategy, click here.
Support Resistance
S1: 45.26 R1: 46.25
S2: 44.96 R2: 46.55
S3: 44.47 R3: 47.05
- Check out our free forex signals
- Follow the top economic events on FX Leaders economic calendar
- Trade better, discover more Forex Trading Strategies
- Open a FREE Trading Account
- Read our latest reviews on: Avatrade, Exness, HFM and XM
Related Articles


Sidebar rates
Related Posts
