A Quick Sell Order In NZD/USD
A trade setup just appeared in NZD/USD. It looks good enough to me, so I just opened a sell forex signal in this pair.
What´s the chart setup?
First off, the Aussie and the Kiwi are diverging; AUD/USD climbed around 50 pips this morning while NZD/USD is more or less unchanged from last night when the forex market opened for the Tokyo session.
So, the Kiwi hasn´t been able to follow the climb in AUD/USD which means that it´s a lot weaker than the Aussie. Now that AUD/USD is turning lower, NZD/USD should decline harder or at least just decline until it reaches our take profit target.
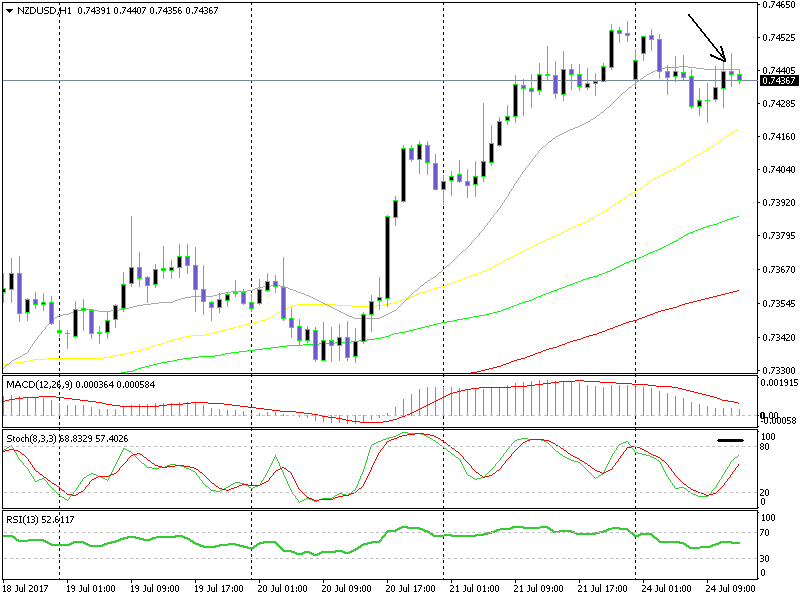
Second, the 20 SMA (grey) has provided support previously and right now it has turned into resistance. In fact, today it has done a nice job providing resistance.
Third, the last hourly candlestick closed as a doji, which signals a reversal after an uptrend, the slight uptrend of the last several hours.
Fourth, the stochastic indicator is overbought, which means that the hourly forex chart is overbought.
 A doji candlestick below a moving average means sell
Yes, it´s true that the bigger trend is up and it is strong. However, we can play counter trend from time to time, it´s like playing counter strike. We took that trade which looks pretty good at the moment and hope to reach TP soon.
- Check out our free forex signals
- Follow the top economic events on FX Leaders economic calendar
- Trade better, discover more Forex Trading Strategies
- Open a FREE Trading Account


