Watch Out! Gold May Have A Bullish Breakout
On Monday, I shared a sell call on the precious metal gold. The idea was to benefit from the overbought situation. But, the market showed no potential for trading and moved only 60 pips in a day. Though our trading signal floated in profit all day, it failed to achieve the target due to thin trading volume. Let's see what the gold has in store for us today.
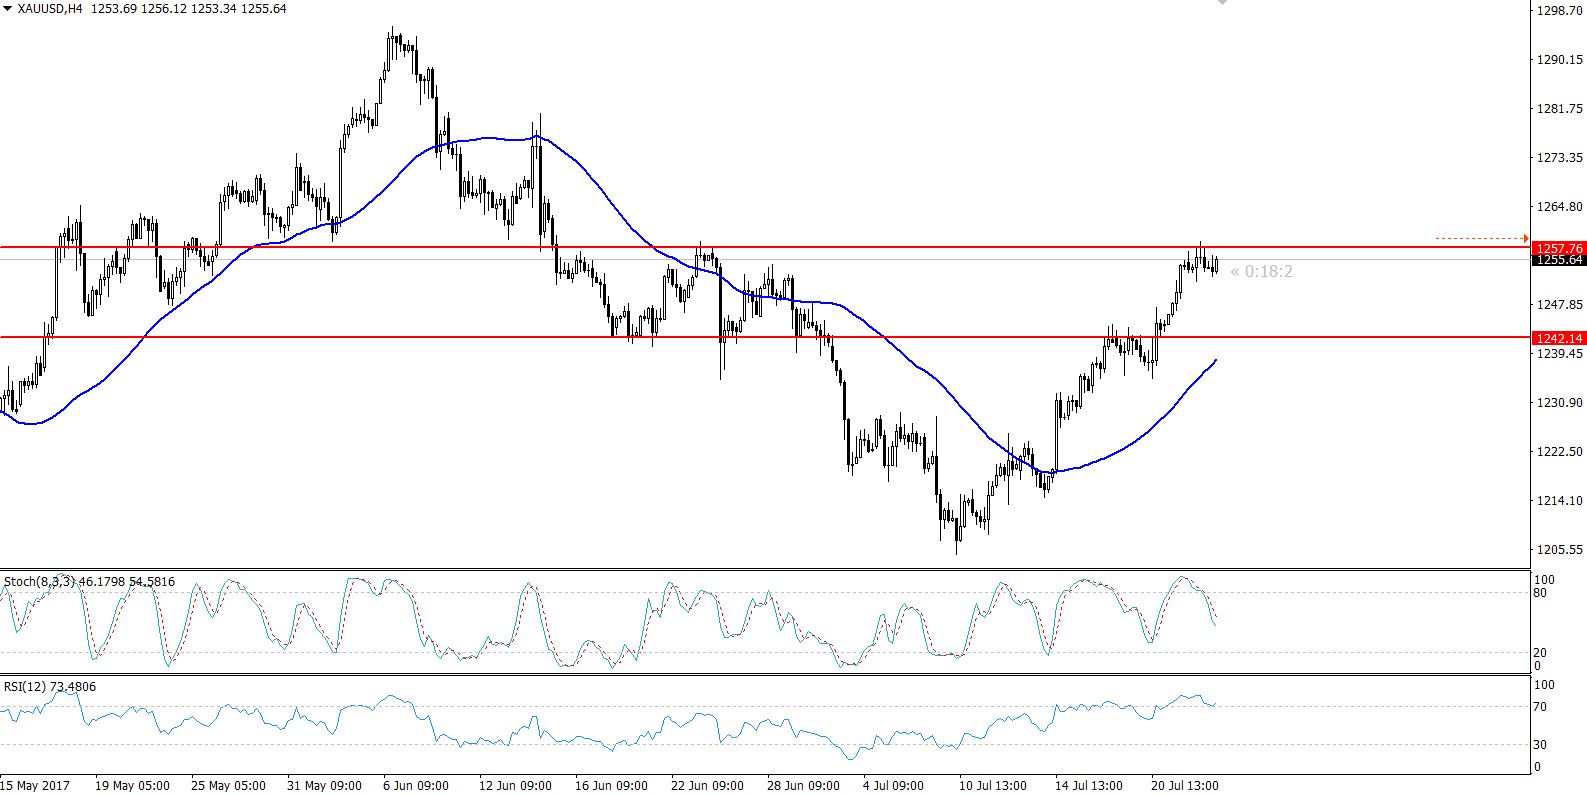
Today, the gold is still trading at the same technical levels, followed by unchanged fundamentals. For instance, on the 4-hour chart, we can see a double top pattern which is extending a resistance at $1257. In addition, the metal has formed multiple reversal patterns, especially Doji candles, signifying investors' neutral bias. For more tips on Candlesticks analysis, check out our candlestick forex trading strategy.
Most often, we see a bearish trend if these neutral candlestick patterns are followed by a bullish trend. So, I'm expecting gold to drop below $1257 with an immediate support at $1253. A break below this level is likely to lead gold to $1249. On the other hand, above $1257, the prices can boost up to $1268.
 Gold – 4-Hour Chart – Double Top
So when we can expect a breakout? There are two options:
First, we can expect a breakout today in the US session upon the release of US consumer confidence figures.
Second, tomorrow, after the FOMC Statement followed by the Fed Interest Rate decision.
As of now, I'm trying to stay away from the market until the US session to avoid the thin volatility trap. Keep following us for trading signals and refer to the FX Leaders article on gold signals to maximize profit potential!
- Check out our free forex signals
- Follow the top economic events on FX Leaders economic calendar
- Trade better, discover more Forex Trading Strategies
- Open a FREE Trading Account