July 31st – Weekly & Daily Outlook For Gold
Over the previous week, the precious metal gold has soared to place a multi-week high at $1271 due to the weaker dollar and ongoing tensions between North Korea & the United States. Since the gold is considered a safe haven asset, investors count on it to protect themselves against the uncertainty.
This week, the gold trend is heavily dependent on the top tier economic figures from the United States – the US NFP & unemployment rate. Before the releases, the yellow metal is likely to trade technicals, so let's take a look.
Weekly Outlook – Gold
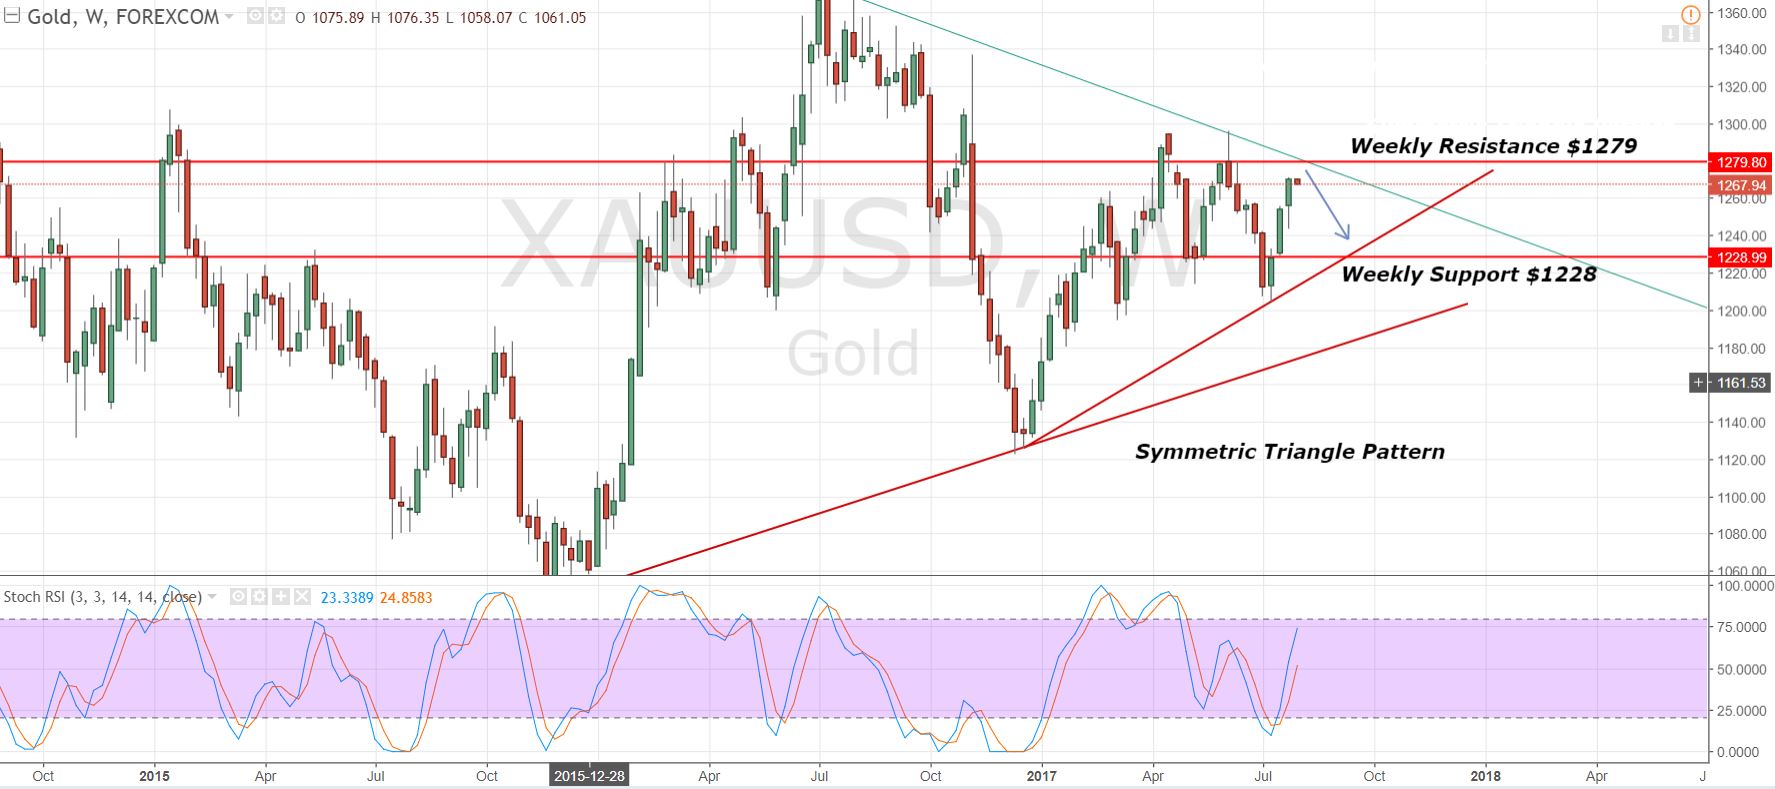
On the weekly chart, the gold has formed a symmetrical triangle pattern which is extending a resistance at $1279. Let me highlight, the gold is very close to the upper edge of the triangle pattern. This can either give it an upward breakout toward $1296 or push it deeper towards $1228. This all depends on the US fundamentals later this week.
Gold – Weekly Chart – Symmetric Triangle Pattern
Intraday Outlook – Gold
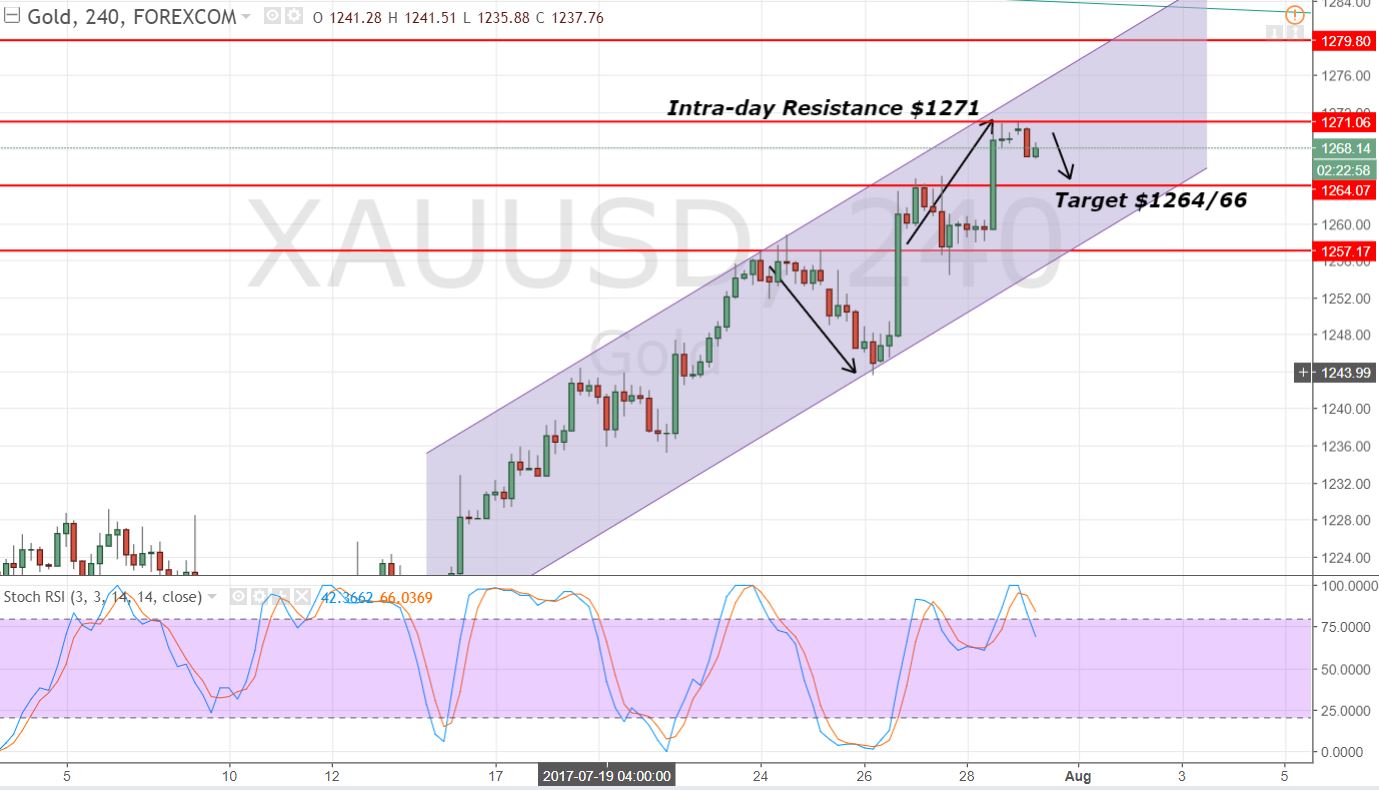
Zooming out to the 4-hour chart, the gold has formed a bullish channel which is providing a resistance at $1271. The resistance is reinforced by a bearish engulfing candlestick pattern followed by a Doji, which is formed right below $1271. Bearish engulfing is a reversal pattern that signifies traders' selling bias. You can refer to the FX Leaders candlesticks trading strategy article to further your understanding of candlestick trading.
 Gold – 4-Hour Chart – Bearish Engulfing & Horizontal Resistance
Gold Trading Plan
Today, the idea is to stay bullish above $1262 with the intent to target $1272. On the other hand, we can stay in sell below $1271 with a stop above $1274 to target $1264. We also need to monitor the Pending Home Sales and Chicago PMI later today to determine further trends in the gold.
- Check out our free forex signals
- Follow the top economic events on FX Leaders economic calendar
- Trade better, discover more Forex Trading Strategies
- Open a FREE Trading Account


