Support & Resistance Levels – Is The Trend Reversing In USD/JPY?
Support Resistance
1 – 110.60 (Medium – Strong orders this morning) 1 – 111 (Medium – Resistance last week)
2 – 110.40-50 (Medium – Previous support) 2 – 1.11.20 (Mild – 200 SMA on H1 chart)
3 – 110 (Strong – Big round number) 3 – 111.50-60 (Strong – 2 MAs on H4 chart)
4 – 109.80-90 (Strong – Solid support last week) 4 – 111.90-112 (Mild – 100 SMA on daily chart)
 ?Can you spot the three upward indicators?
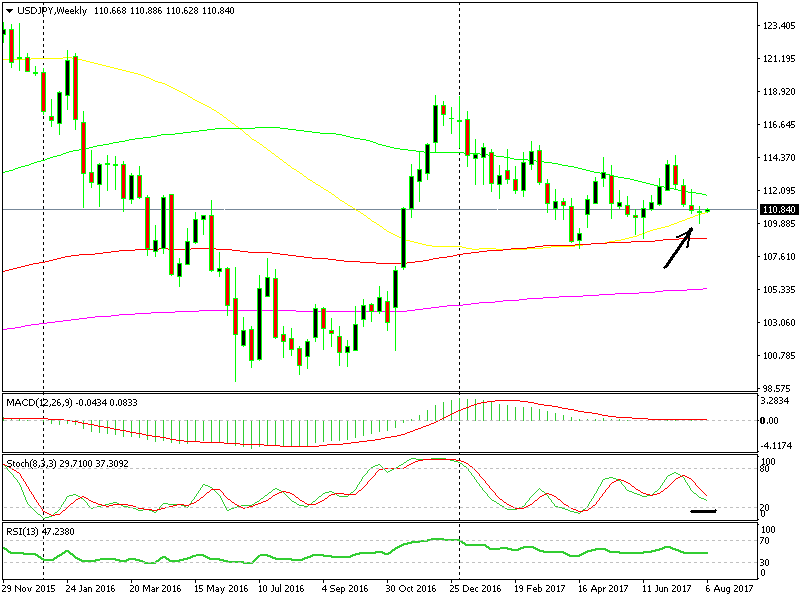 ?Can you spot the three upward indicators?
The technical analysis clearly points upward and the 120 pip move higher last Friday was a sign that a reverse is taking place. The mildly positive US economic data on Friday sent this forex pair 120 pips higher, which means that the fundamentals are bullish at the moment.
Trade Idea: According to the analysis above, I would only look to buy now. Although, the H4 chart is overbought so it would be wise to wait for a retrace lower to 111.40-50 and then look to open a buy forex signal targeting 30 pips as the first target and pulling the stop higher as the price climbs up.
- Check out our free forex signals
- Follow the top economic events on FX Leaders economic calendar
- Trade better, discover more Forex Trading Strategies
- Open a FREE Trading Account
- Read our latest reviews on: Avatrade, Exness, HFM and XM
Related Articles


Sidebar rates
Related Posts
