Is AUD/USD Finally Turning Around?
About two months ago we opened a long term sell forex signal in AUD/USD. Based on the monthly chart, the price had reached a critical level and is at another critical level right now.
What was the previous critical level?
 The 50 SMA is the second big level
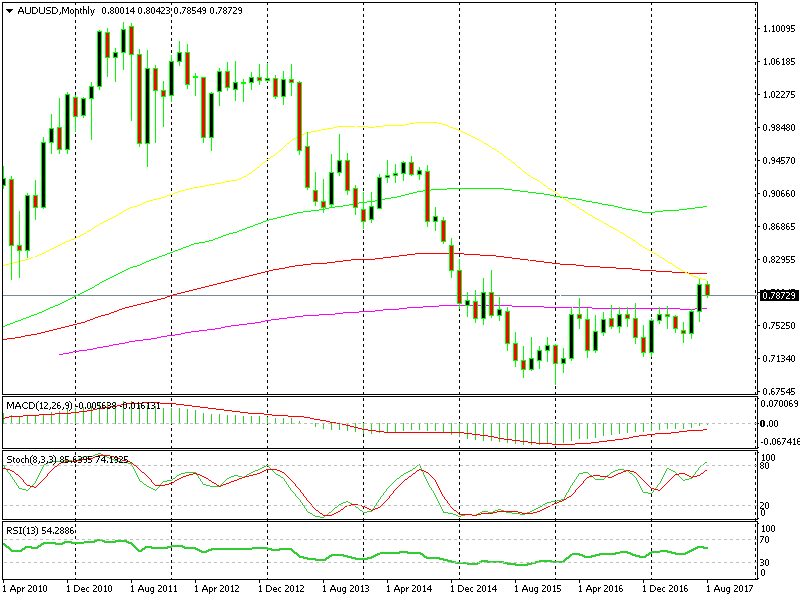
As you can see from the monthly AUD/USD chart above, about two months ago the price was close to the 200 SMA (purple) moving average. That moving average had provided resistance for about two years. So, the odds were that the price was going to turn around again, as it had done countless times before.
But, the situation had changed for the Dollar, and this pair finally broke the 200 SMA after nearly two years.
Now we’re at another important level, or we were last week. We’re just below the 50 SMA on the monthly chart, and we´re still below the 100 SMA on the weekly chart (which we highlighted many times in July).
The 100 weekly SMA was broken twice over the last two weeks. However, the price eventually closed below it, so the breaks don't count.
Right now, it looks like both these moving averages are holding on two different time frame charts and a reverse is starting to take place.
Trade Idea (Long Term): I still hope we see a retrace higher or another go at the top, so I’ll be watching the daily forex chart. Stochastic is oversold at the moment so a pullback might happen pretty soon. If it happens, then I´ll look to open a sell forex signal when stochastic becomes overbought. It might take some time, but I'm ready to wait.
- Check out our free forex signals
- Follow the top economic events on FX Leaders economic calendar
- Trade better, discover more Forex Trading Strategies
- Open a FREE Trading Account


