


We decided to sell NZD/USD already. But, what indicators are signalling to us to sell?
 How many reasons do you see on this chart for going short?
- For starters, since Wednesday when the Reserve Bank of New Zealand delivered some hawkish comments, this pair looks fundamentally bearish.
- The trend has been down over the last two weeks and there has only been one-way traffic during this time
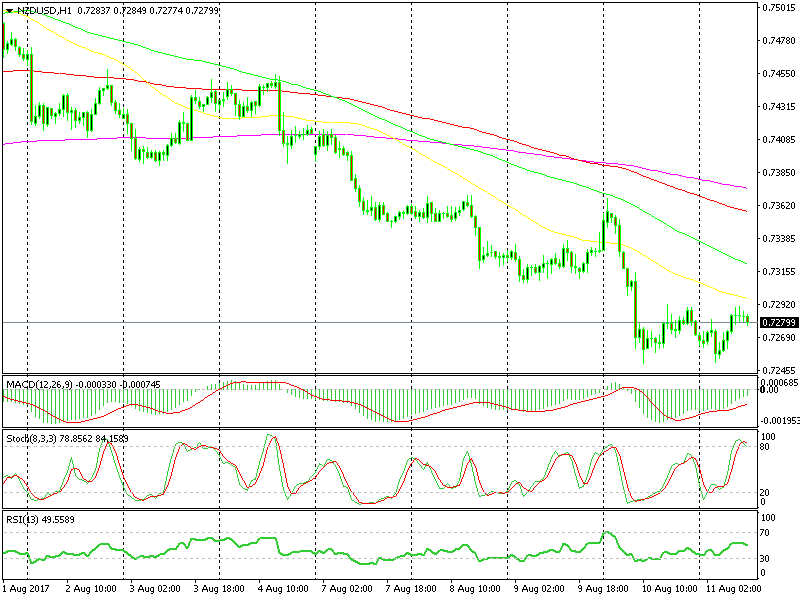
- This morning´s move higher is just a retrace of the 2-week downtrend
- We´re below the 50 SMA (yellow) on the H1 chart which is supposed to provide some resistance in case we move higher
- The last 3 hourly candlesticks have formed 3 dojis, which are reversing indicators after an uptrend or after a retrace
- The stochastic indicator is overbought in the same time frame chart
Seven indicators pointing down should be enough for a forex trade to be successful. You can't know for sure how a trade will evolve when you trade forex, but these indicators are more than enough to open a trade. Now let´s see if the market agrees with our analysis.
Check out our free forex signals
Follow the top economic events on FX Leaders economic calendar
Trade better, discover more Forex Trading Strategies
Related Articles


Comments
Subscribe
Login
0 Comments


