A Trade Setup To Sell USD/CAD
We just opened a sell forex signal in USD/CAD as you might have noticed from the notification you received if you are a premium member.
The chart setup looks pretty good for sellers in two time-frames, which increases the odds that the price goes in our direction. Let´s have a look at what these two time-frame charts are telling us.
H1 Chart
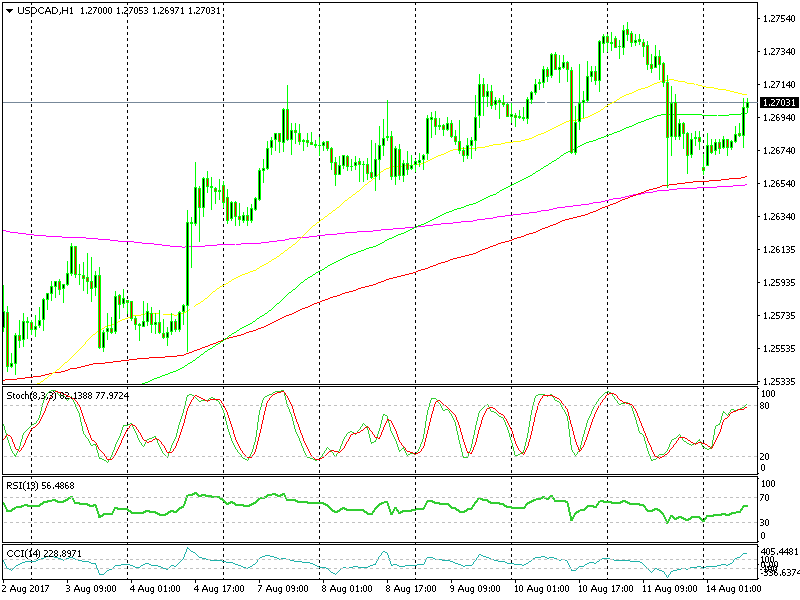
The 50 SMA seems to have turned into resistance
On the hourly forex chart, the trend is heading up. We´re going against the trend, although there´s a much bigger trend which began a few months ago.
As far as the hourly chart extends, the trend is up. That being said, the 50 SMA (yellow) and the 100 SMA (green) that have been keeping the uptrend in place have been broken. Now the 50 SMA is providing resistance on top.
The SMA and the other indicators at the bottom of the chart are oversold or nearly there. It looks like the retrace higher is done and now the downtrend will follow.
H4 chart
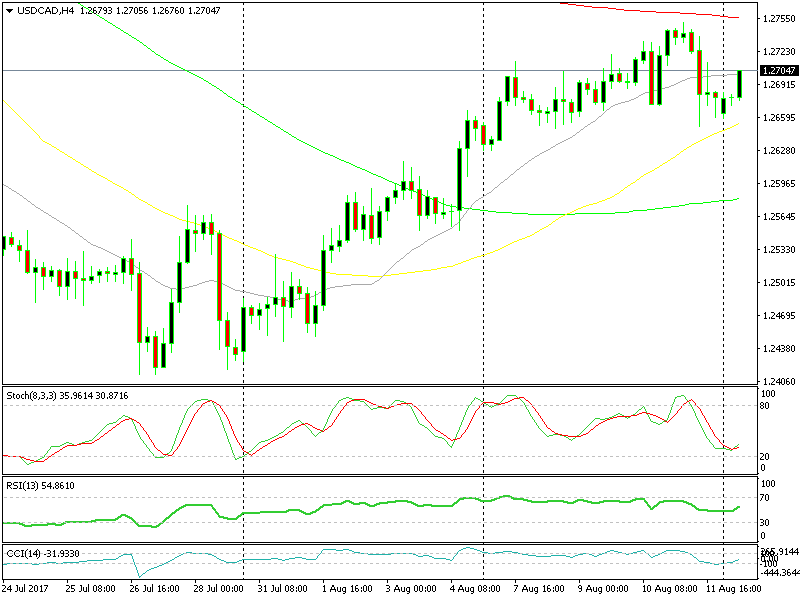
The 20 SMA is the one providing resistance on the H4 chart
If we switch to the H4 chart, we see that in the last two weeks, the 20 SMA (grey) has been keeping the uptrend in place. However, it was broken last Friday and now that moving average is providing resistance.
The forex saying goes, “what used to be support will turn into resistance” and that seems to be the case now. So though we opened a sell forex signal in this pair, we might move the stop a bit higher shortly, because we placed it pretty tight.
- Check out our free forex signals
- Follow the top economic events on FX Leaders economic calendar
- Trade better, discover more Forex Trading Strategies
- Open a FREE Trading Account


