Can You Trade Moving Averages in Gold?
Gold has slipped between two moving averages on the hourly chart. Moving averages are great trading indicators and the gold respects them pretty often, so there might be a trade in sight.
Looking at the H1 gold chart below, we see that the price has fallen in between the 50 SMA (yellow) and the 100 SMA (green).
Last week, the 20 SMA (grey) held the uptrend in place. On Friday though the price pierced that moving average a few times, which was a sign that the uptrend might have stalled.
 We´re waiting for Gold to reach the 50 SMA so we can sell
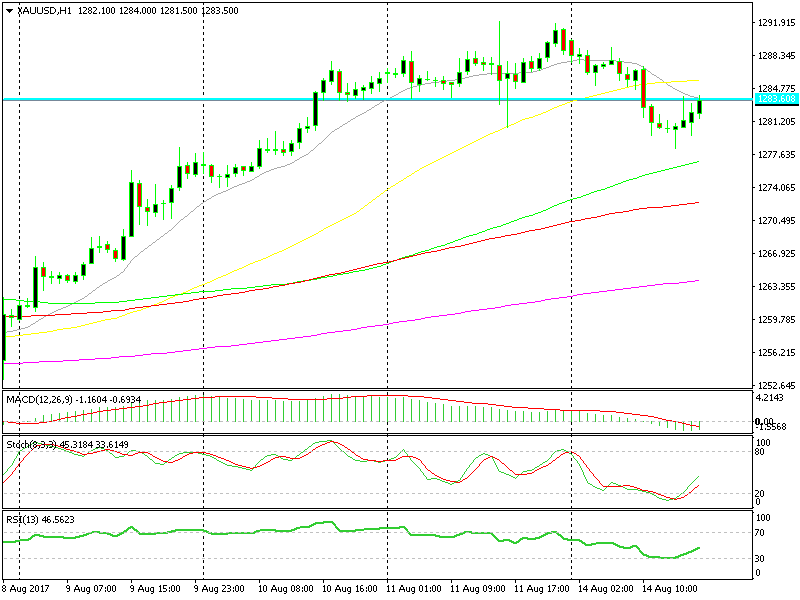
We see that the gold has broken below the 20 SMA early this morning and it broke the 50 SMA later on.
Now, the 20 SMA is providing resistance on top. This was a previous support area on Friday, so it is likely to turn into resistance now.
But if this level and the 20 SMA fail to contain gold diggers, the 50 SMA stands close above. That moving average is definitely going to provide some solid resistance, so that´s a good selling spot.
Trade Idea: Sell gold at the 50 SMA, around $1,286 with a stop above the moving average and TP at today´s low. By the time we reach the 50 SMA, stochastic should be overbought, so the case for sellers will be stronger.
- Check out our free forex signals
- Follow the top economic events on FX Leaders economic calendar
- Trade better, discover more Forex Trading Strategies
- Open a FREE Trading Account
- Read our latest reviews on: Avatrade, Exness, HFM and XM
Related Articles


Sidebar rates
Related Posts
