Yesterday’s Mistake Becomes Today’s Trade – Going Long USD/JPY


Yesterday we highlighted a trade idea in USD/JPY but were unable to enter it since that trade happened too quickly. Today, the same scenario is unfolding and we took the trade. Will it work again this time?
Yesterday we mentioned the 50 SMA (yellow) on the H1 chart which came at around 109. The price had formed an intraday uptrend after failing to break the support which stretches from 108.00 to 108.80. That round level made it 2 technical indicators pointing up yesterday.
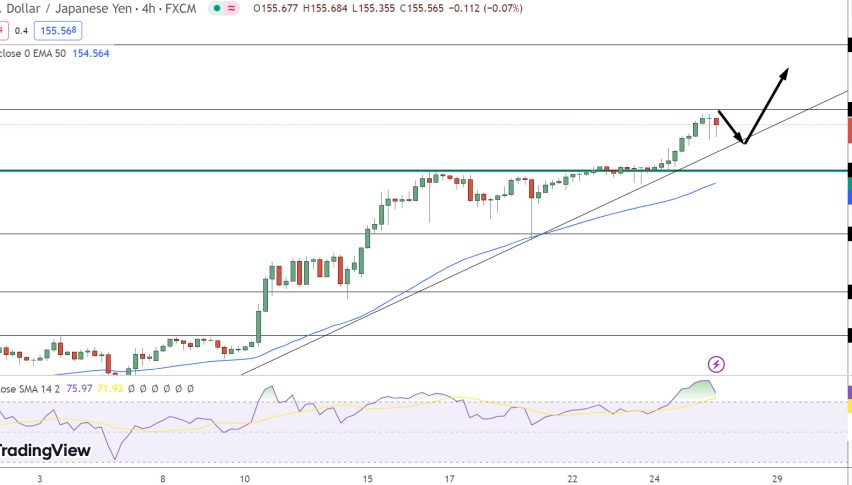
Today we don’t have the 109 level to cover our backs, but the 100 SMA (green) has already caught up with the price, so that´s 2 indicators pointing up again.
 We see the same chart setup today, so up we go?

The intraday trend is still up, which makes today decline just a normal retrace before the next move higher, if that happens.
The stochastic indicator is oversold and RSI is almost there in the same time frame chart, so this pullback lower is complete.
The decline seems to have slowed (or stopped) right now as the 100 SMA provides support, while the 50 SMA is just a few pips below, so we decided to open a buy signal here. Let´s be patient and see how this forex trade unfolds.