What’s Going On With Our AUD/USD Signal?
A while ago we opened a sell forex signal in AUD/USD after this pair made a pullback higher from overnight lows which reached 0.7867.This m
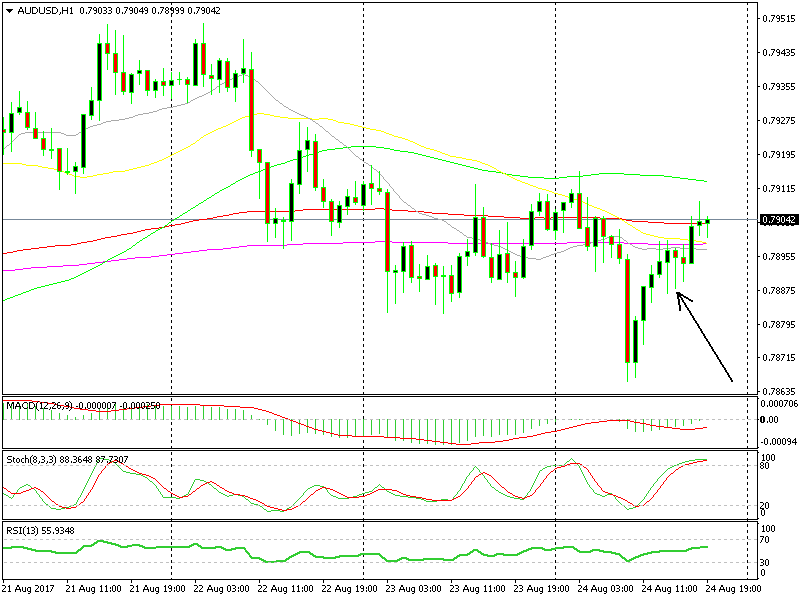
A while ago we opened a sell forex signal in AUD/USD after this pair made a pullback higher from overnight lows which reached 0.7867.
This morning the pair was recuperating some of the losses and at some point, I thought the pullback/retrace was done, but as we now know it wasn’t.
 The H1 chart doesn't look very good for sellers
In the hourly chart, we see that a few hours ago the price was below a number of moving averages which were tangled together and the stochastic indicator was also overbought. This is the perfect setup to enter a trade with the trend; wait for a retrace and when the price reaches a moving average (20 SMA, 50 SMA, 100 SMA, 200 SMA) and the chart is overbought, then sell.
The sellers did try a few times the downside after that as you can see from the 3 candlesticks with long shadows beneath the body, but without much success. We broke above those moving averages next and now we are breaking above the 100 SMA (red).
But there’s still hope, the 20 SMA is providing resistance on the H4 chart and besides that, this chart is almost overbought so hopefully the buyers will give up and the sellers take over, let´s see.
- Check out our free forex signals
- Follow the top economic events on FX Leaders economic calendar
- Trade better, discover more Forex Trading Strategies
- Open a FREE Trading Account


