A Potential Buy Entry in WTI Crude Oil – Range Bound Market
During the Asin sessions, the crude oil continued to trade bearish. This is despite the EIA report which showed a draw of 3.3 million barre
•
Last updated: Monday, August 28, 2017
During the Asin sessions, the crude oil continued to trade bearish. This is despite the EIA report which showed a draw of 3.3 million barrels though it was supposed to be bullish. What's going on?
According to the Energy Information Administration (EIA) report, it recorded an inventory draw of 3.3 million barrels last week followed by a draw of 8.95 million barrels. The oil was supposed to gain on the news, but it surprisingly fell after pulling slightly higher.
Key Technicals Points
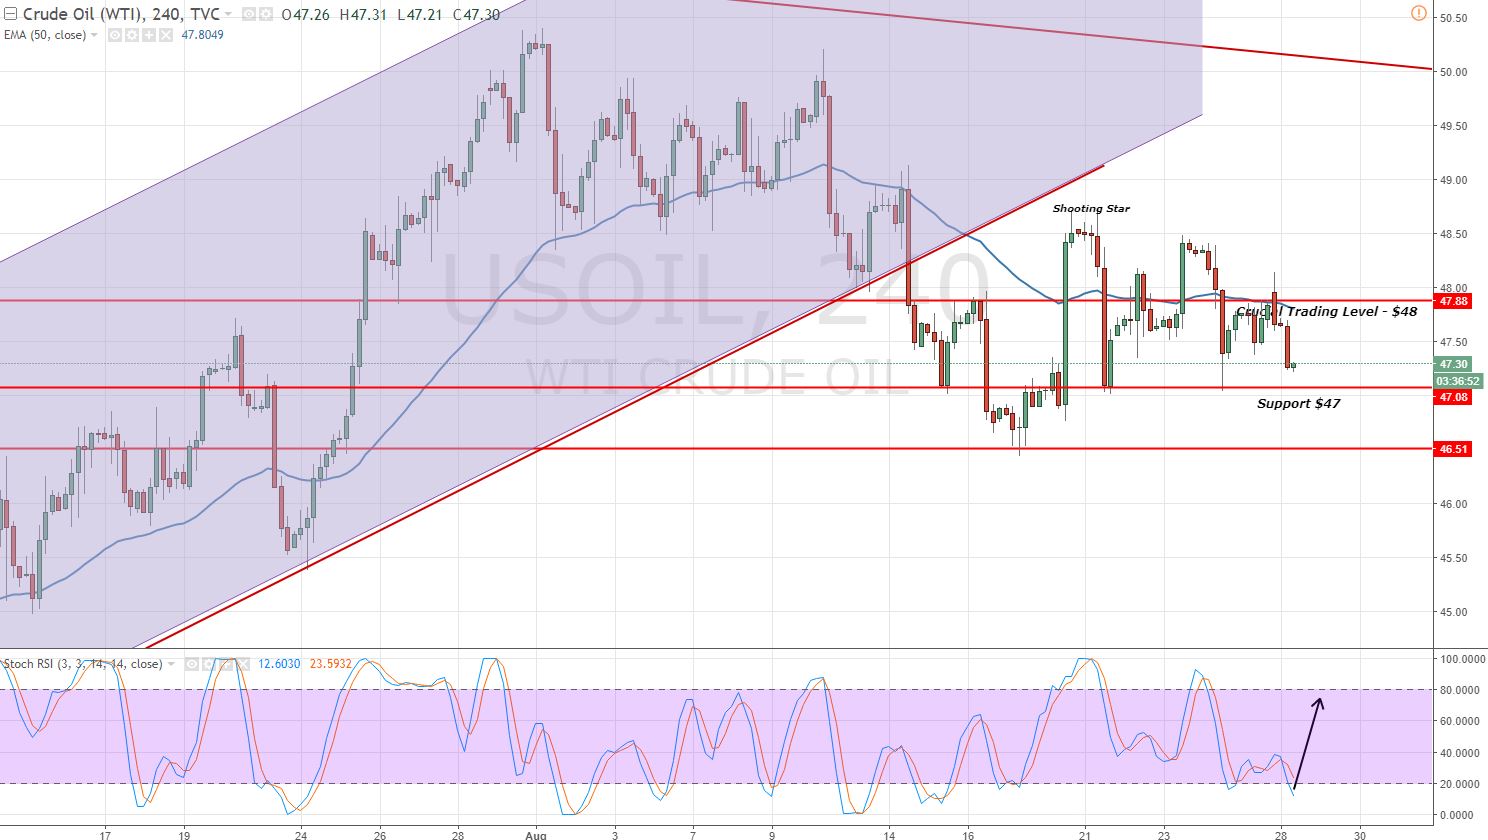
 Crude Oil – 2-Hour Chart – Sideways Market
 Crude Oil – 2-Hour Chart – Sideways Market
- On the daily chart, oil has to maintain a sideways trend from $47- $48, forming neutral candles.
- The 50- periods EMA is near $48, suggesting that the oil prices are far away from their average prices & it should pull back to $48 zone.
- The double bottom support is at $47 and oil is likely to test the same level again. Therefore, we can see the pull back from here.
Crude Oil Trading Plan
I'm looking to take a buy position at $47 with a target of $47.75 today as the market is facing thin trading volume.
- Check out our free forex signals
- Follow the top economic events on FX Leaders economic calendar
- Trade better, discover more Forex Trading Strategies
- Open a FREE Trading Account
ABOUT THE AUTHOR
See More
Arslan Butt
Lead Markets Analyst – Multi-Asset (FX, Commodities, Crypto)
Arslan Butt serves as the Lead Commodities and Indices Analyst, bringing a wealth of expertise to the field. With an MBA in Behavioral Finance and active progress towards a Ph.D., Arslan possesses a deep understanding of market dynamics.
His professional journey includes a significant role as a senior analyst at a leading brokerage firm, complementing his extensive experience as a market analyst and day trader. Adept in educating others, Arslan has a commendable track record as an instructor and public speaker.
His incisive analyses, particularly within the realms of cryptocurrency and forex markets, are showcased across esteemed financial publications such as ForexCrunch, InsideBitcoins, and EconomyWatch, solidifying his reputation in the financial community.


