1.08 is an Amazing Level for USD/JPY! Or is it the 100 SMA?


We have pointed out this level quite a lot in recent weeks, but we have no other choice but to talk about it again. The price in USD/JPY has been banging against it so often lately, though it has failed to break it and has bounced back up every time.
It´s not that we want to repeat ourselves, but it seems like déjà vu watching it being tested and seeing the price reverse quickly after just one attempt. By the way, by 1.08 I mean the area between 1.0810 and 1.0880.
The sellers had another go at the low levels of 1.08 yesterday as EUR/USD broke above 1.20, and then reversed and closed the day around 150 pips higher.
 This is quite a reverse we are seeing in USD/JPY
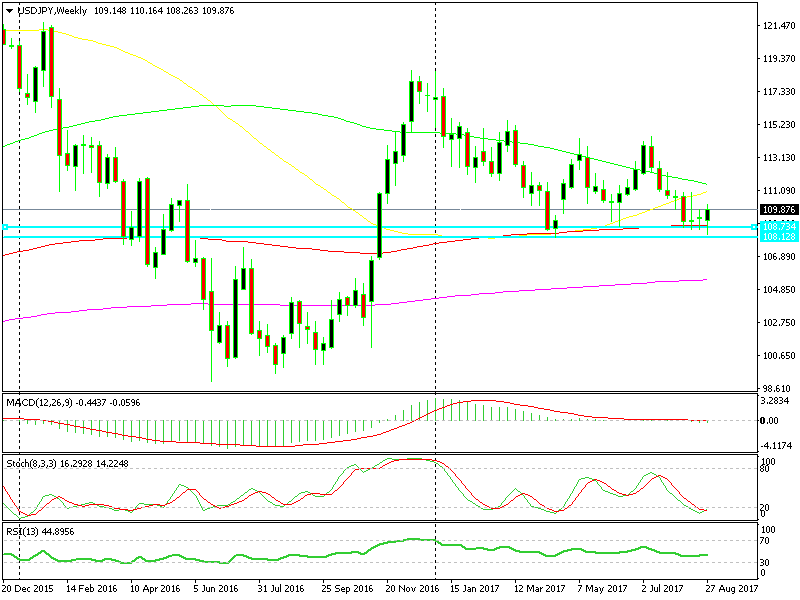
This morning, USD/JPY completed another leg higher jumping above 110, which takes us even further away from 108, so we can definitely say that the support at 108 held another time. Some say it is the resistance between 108, while others argue it is the 100 SMA (red) on the weekly chart that`s providing resistance down there, although it doesn’t really matter.
Now this forex pair is headed up and the next target is 114, but we have to take out 111 first, which is a resistance area. The weekly USD/JPY chart looks pretty bullish right now and it comes after 2 doji candlesticks. From now on I´ll be looking for an entry spot to go long on this pair. Although, I would prefer to enter on a retrace lower around 109.