Last night we opened a forex signal in GBP/USD as it retraced lower after a strong rally over the last few days. The logic behind the trade was that a bounce was bound to happen in the smaller time frame charts given the recent USD weakness.
At that time, this pair was sitting just above the 200 SMA on the H1 forex chart, which was providing support. That was another technical indicator pointing up, apart from the last few day's uptrend. Stochastic was also oversold in this time frame chart.
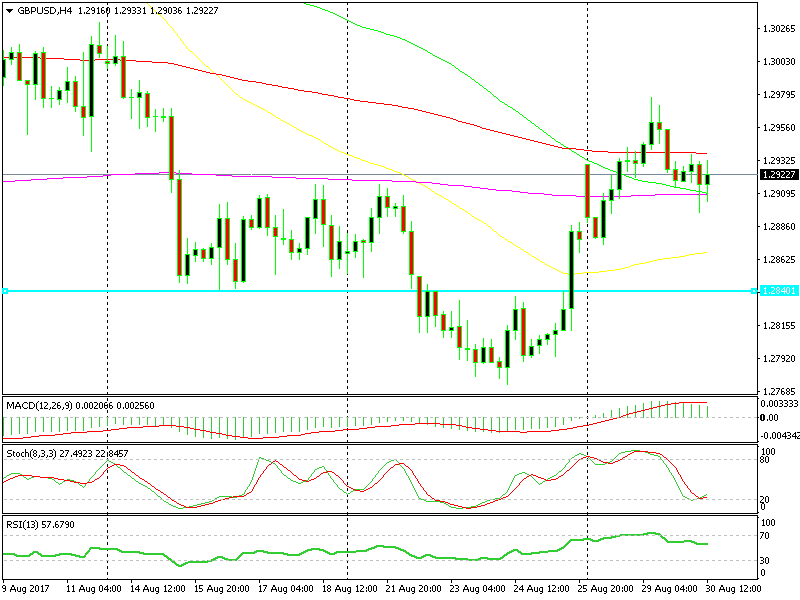
 The moving averages are doing a good job in providing support
GBP/USD climbed about 20 pips overnight though that can’t be considered a proper bounce. The 50 SMA on the H1 chart kept playing resistance all morning, causing the price to get stuck between the 100 SMA at the bottom and the 50 SMA on top.
If we switch to the H4 chart though, the picture seems a bit brighter for buyers. The 100 SMA (green) and the 200 SMA (purple) are both providing resistance in the 1.2900-10 area.
The sellers had a go at these moving averages and the 1.29 level earlier today. They weren't successful and we are now back above those indicators and in the 1.2920-30 region.
The stochastic indicator is also oversold and turning up which means that this pair is oversold, so this time frame chart looks pretty favorable for buyers. While other major currencies have been declining against the USD today, GBP/USD has held up quite well, providing us with another bullish signal. Let´s wait and see how this trade will unfold today.