
How’s the NZD/USD Chart Setup Treating our Signal?


Yesterday we opened a sell forex signal in NZD/USD. The pair had completed a retrace higher on the hourly forex chart, after trending down for a few days. Let’s see how this signal has evolved so far.
When I left the market last night, the price action looked pretty favorable for sellers. NZD/USD was heading down and we were in the 0.7150 region.
Today, the chart setup doesn’t look so good. NZD/USD has turned up and we’re in the 0.7180s region now.
It looks like AUD/USD is pulling this pair up. The Aussie jumped around 40 pips last night before the RBA (Reserve Bank of Australia) cash rate statement and it’s crawling higher now, which is giving the Kiwi a push.
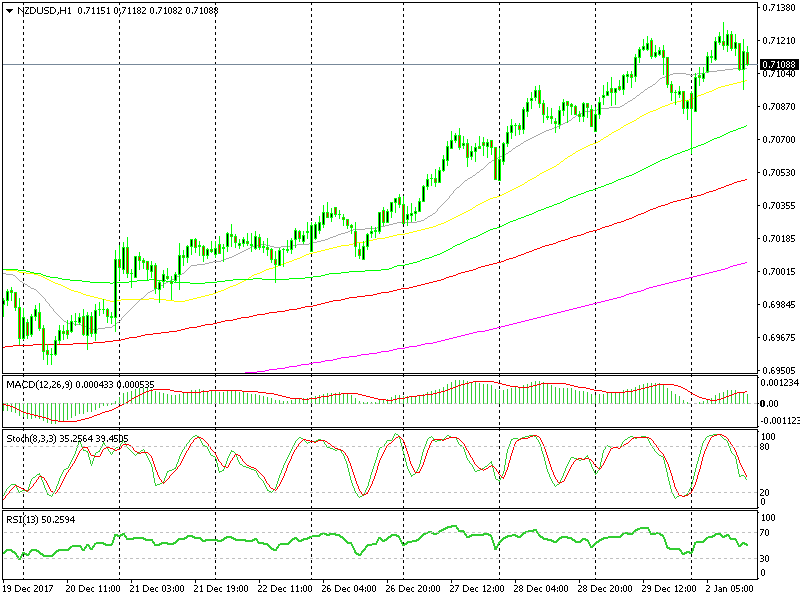
Overbought stochastic is the only indicator going in our direction, but the upside seems exhausted.
The good thing is that the H1 chart is overbought now and the H4 chart is almost overbought. Hopefully, the buyers will get fed up and the sellers will return, which would take this forex pair to the safety zone below the 100 SMA.
The data from North America is scarce today so we can't expect any help from there. We are stuck relying on the price action and technical indicators to figure out which way the market wants to go. For now, the climb has stalled, so let’s hope NZD/USD turns back down again soon.
Check out our free forex signals
Follow the top economic events on FX Leaders economic calendar
Trade better, discover more Forex Trading Strategies
Related Articles


Comments
Subscribe
Login
0 Comments


