Crude Oil Hits Take Profit – API Reports Ahead!
As I mentioned in my earlier update Crude Oil Ready for Retracement - A Potential Trade Idea. The Crude Oil was a solid Buy above $47 as it
As I mentioned in my earlier update Crude Oil Ready for Retracement – A Potential Trade Idea. The Crude Oil was a solid Buy above $47 as it traded more than 100 pips upward. What's important for Crude Oil traders today? Let's figure out…
U.S. API Weekly Crude Oil Stock
The American Petroleum Institute is due to report the weekly inventory levels of US crude oil, gasoline and distillates stocks. The figure shows how much oil and product is available in storage. The indicator gives an overview of US petroleum demand. The draw in inventories increases the prices of Crude Oil, whereas, the inventory builds diminishes the prices over lower demand concerns.
The time of release is tentative, but it's most often releases during the US sessions. The previous figure reported a build of 2.791M barrels. Let's wait and watch for the new figures.
Technical View of WTI Crude Oil
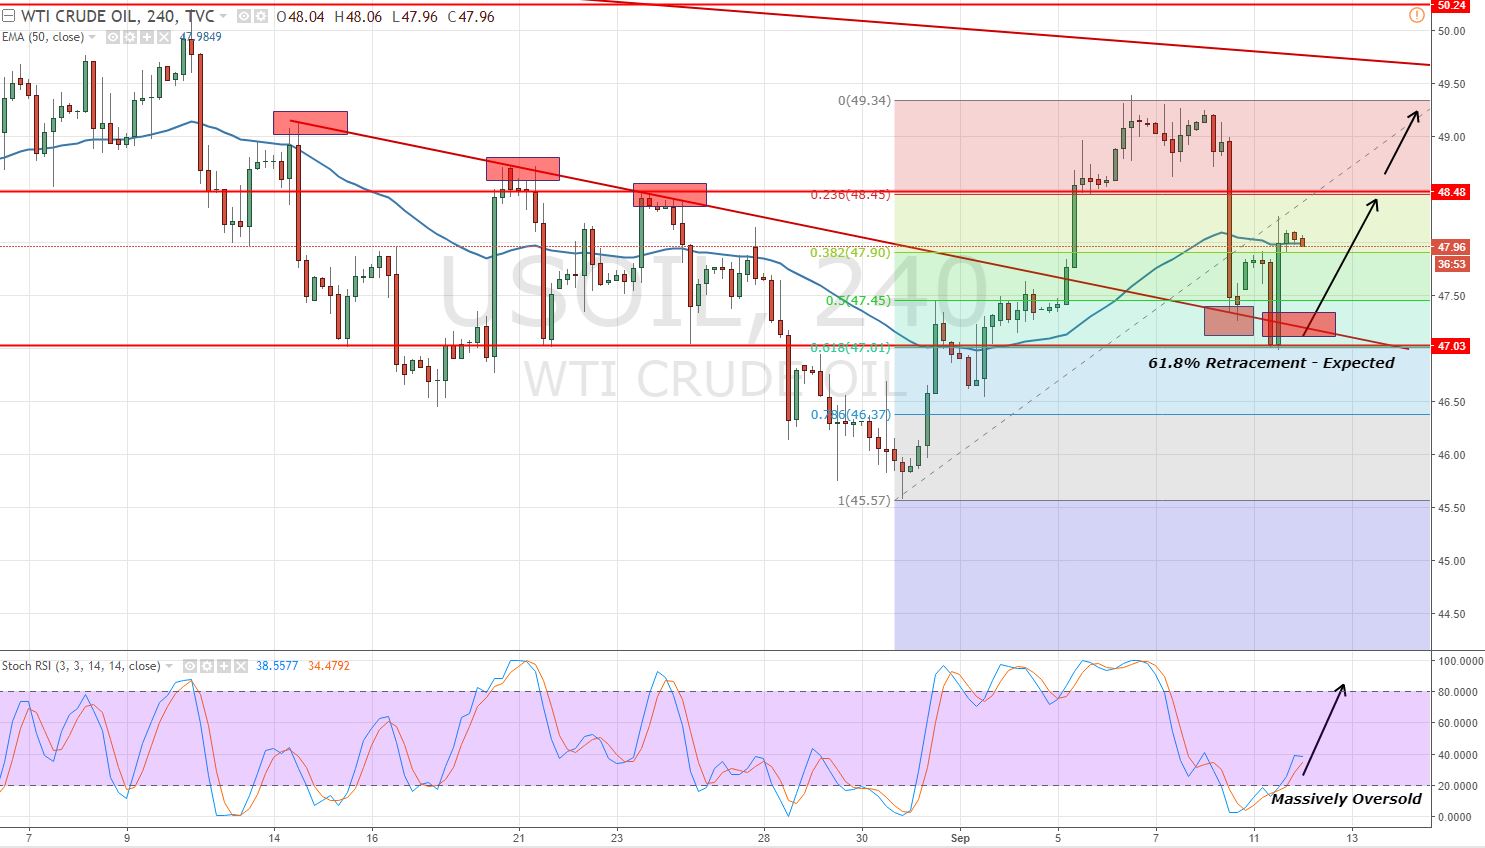
Technically, the Crude Oil has completed the 61.8% Fibonacci Retracement at $47 (same old level) and pulled back to retest the 50- periods EMA at $48. For now, investors are waiting for the fundamentals, and technical levels will adjust to new events accordingly. Newbies are highly recommended to check out FX Leaders Fibonacci Trading Strategy to enhance their profitability.
 Crude Oil – 4 Hour Chart – 61.8% Fibonacci
The immediate support prevails at $47.90, $47.45 and $47 ( a solid one) while the resistance is at $48 and $48.80. Stochastics are signaling bullishness in the Oil.
Crude Oil Trading Plan
Today, I'm sticking with the same old plan to stay in and sell below $48.75 with a stop at $49.30 and profit at $47.75 and second profit at $47. Traders, it's better to wait for the API report before entering any position in Oil prices often reacts more than 100 pips on this news. Good luck!
- Check out our free forex signals
- Follow the top economic events on FX Leaders economic calendar
- Trade better, discover more Forex Trading Strategies
- Open a FREE Trading Account
 Crude Oil – 4 Hour Chart – 61.8% Fibonacci

