Support & Resistance Levels for USD/JPY
This forex pair has made a decent turnaround in the last couple of days; it broke the 108 support level on Friday and everyone thought that
This forex pair has made a decent turnaround in the last couple of days; it broke the 108 support level on Friday and everyone thought that 105 was coming next, but that was it for the downside.
That said, the trend is still down and the situation with North Korea hasn’t really improved so we might see a turnaround again and head down to the abyss for that matter. Anyway, let’s have a quick look at the support & resistance levels nearby.
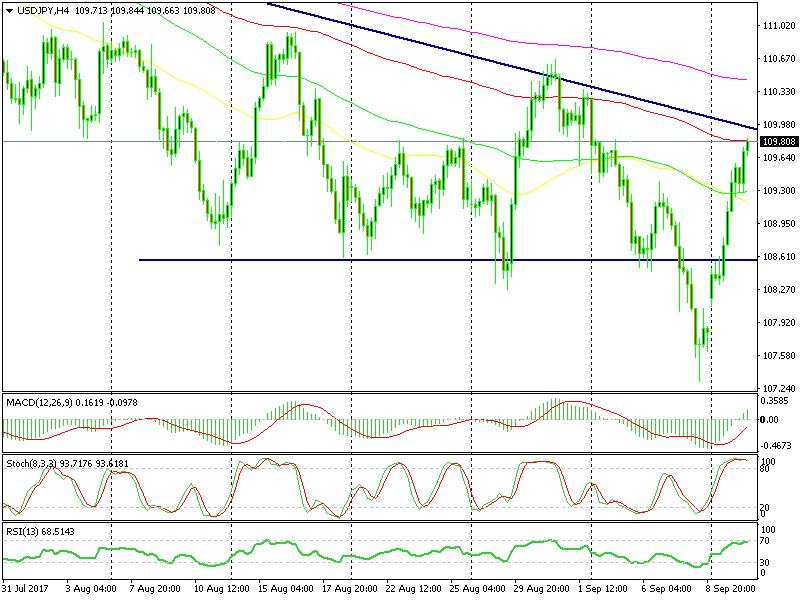 The reverse higher is swift, but the downtrend is still in tact
Support
1 – 109.50 (Mild – Resistance in the last 2 days)
2 – 109.30 (Medium – 200 SMA on H1 chart)
3 – 109 (Strong – Big round number and the 100 SMA on H1 chart)
4 – 108.60 (Strong – Previous support last week)
Resistance
1 – 109.80 (Medium – 100 SMA on the H4 chart and a buffer zone for 110)
2 – 110 (Strong – Big round number and the ascending trend line)
3 – 110.45-50 (Strong – 200 SMA on the H4 chart and previous resistance)
4 – 110.70-80 (Medium – 20 SMA on daily chart)
The North Korean officials at the UN are making (small) war talk but the JPY is unchanged. They said that “the coming measures by North Korea will make the US suffer the greatest pain ever”.
These guys are basket cases, period. But the market seems to have gotten used to their rhetoric. Anyway, these are the levels I will try to use today if I see a good chart setup in USD/JPY.
- Check out our free forex signals
- Follow the top economic events on FX Leaders economic calendar
- Trade better, discover more Forex Trading Strategies
- Open a FREE Trading Account
- Read our latest reviews on: Avatrade, Exness, HFM and XM
Related Articles


Sidebar rates
Related Posts
