WTI Crude Oil – 75 Pips Trade Setup
The crude Oil continues to trade bullish maintaining a broad trading range of $47.20 - $49.35. Trader's focus remains on uncertainty lead b
The crude Oil continues to trade bullish maintaining a broad trading range of $47.20 – $49.35. Trader's focus remains on uncertainty lead by Hurricane Harvey which is causing sharp fluctuations across all metrics. Check out the trade setup below.
EIA Report Update
The latest Energy Information Administration (EIA) data showed an inventory build of 5.9 million barrels for the previous week followed by a build of 4.6 million barrels. It's a slightly bearish news, however, the impact remains bullish.
Technicals Outlook
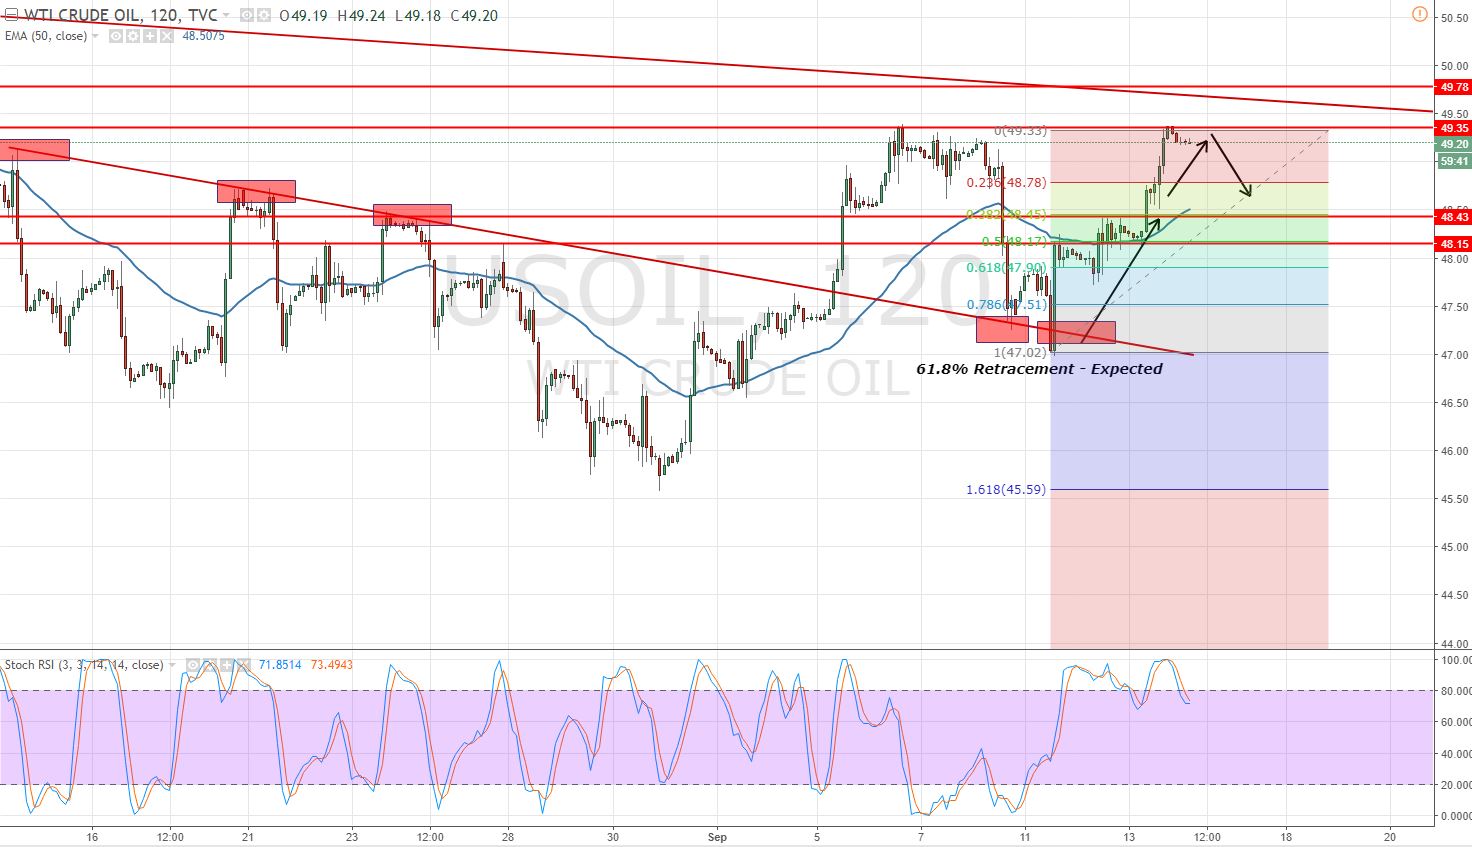
On the 4-hour chart, Oil is holding below a solid resistance level of 49.35 and has formed a bearish engulfing candle which is the first selling signal for us. The 50- periods EMA is near $48.35, suggesting a bullish trend in Oil. The prices are far away from their average prices, and it should pull back to the $48 zone before taking further buy.
 Crude Oil – Double Top Pattern
 Crude Oil – Double Top Pattern
Oil has a formed a double top pattern at $49.35, and candles closing below it is strengthening the bearish sentiment. Lastly, the leading indicators are stuck in an overbought region and suggesting we may get retracement in Oil up to $48.78 (23.6%) and $48.45 (38.2%).
Crude Oil Trading Plan
Today, we need to monitor the key trading level of $49.35. Anything below that the market is likely to stay bearish until $48.75 and $48.15. The breakage above $49.40 can give us a buying opportunity until $48.75. Good luck!
- Check out our free forex signals
- Follow the top economic events on FX Leaders economic calendar
- Trade better, discover more Forex Trading Strategies
- Open a FREE Trading Account


