Triple Bottom Pattern In GBPJPY – Get Ready To Jump In!
Ongoing geopolitical tensions between North Korea and the United States aroused again, increasing the tensions among investors. The Japanes
Ongoing geopolitical tensions between North Korea and the United States aroused again, increasing the tensions among investors. The Japanese crosses finally got a reason to retrace back.
Technical Overview – GBPJPY
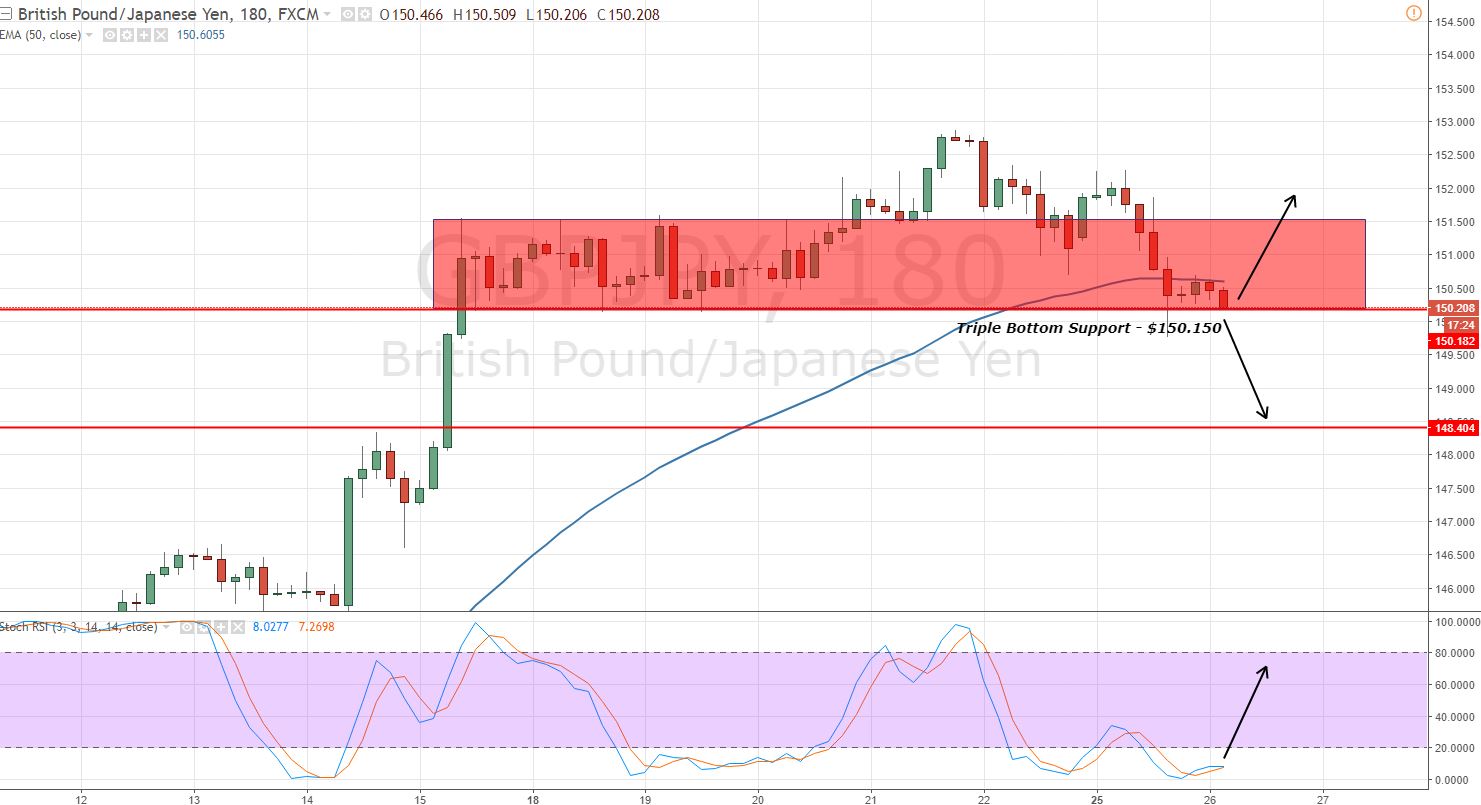
On the 3-hour timeframe, we can see the candlestick pattern "three black crows,” which signifies the bearish bias of traders. However, $150.150 is supporting the pair.
Oh, the pair just had a 50- periods moving average bearish crossover, which signals a selling trend of the investors. Not only this, but the candles closing below moving averages are confirming the bearish sentiment.
 GBPJPY – 3 Hour Chart – Triple Bottom
But wait, the leading indicators are in divergence with moving averages. The pair is massively oversold and discouraging me to take a sell position here. Check out my previous update about intra-day support and resistance of GBPJPY.
GBPJPY – Trading Plan
The pair is bit confusing now as it's not sparing a sure shot trade idea. Anyhow, I'm focusing on the $150.150. Above this, the pair is likely to target up to $151 and below this, the Guppy has a long way to target $148.85. Good luck and keep following for more updates!
- Check out our free forex signals
- Follow the top economic events on FX Leaders economic calendar
- Trade better, discover more Forex Trading Strategies
- Open a FREE Trading Account
 GBPJPY – 3 Hour Chart – Triple Bottom

