Bullish Crossover In EURJPY – Ready to Place a Trade?
Good afternoon, traders. The market seems a bit shaky today due to the tug of war between fundamentals and technicals. Considering the risk
Good afternoon, traders. The market seems a bit shaky today due to the tug of war between fundamentals and technicals. Considering the risk and uncertainty associated with the market it's better to trade Crosses. Let's find out another hot set up on EURJPY.
Technical Overview – EURJPY
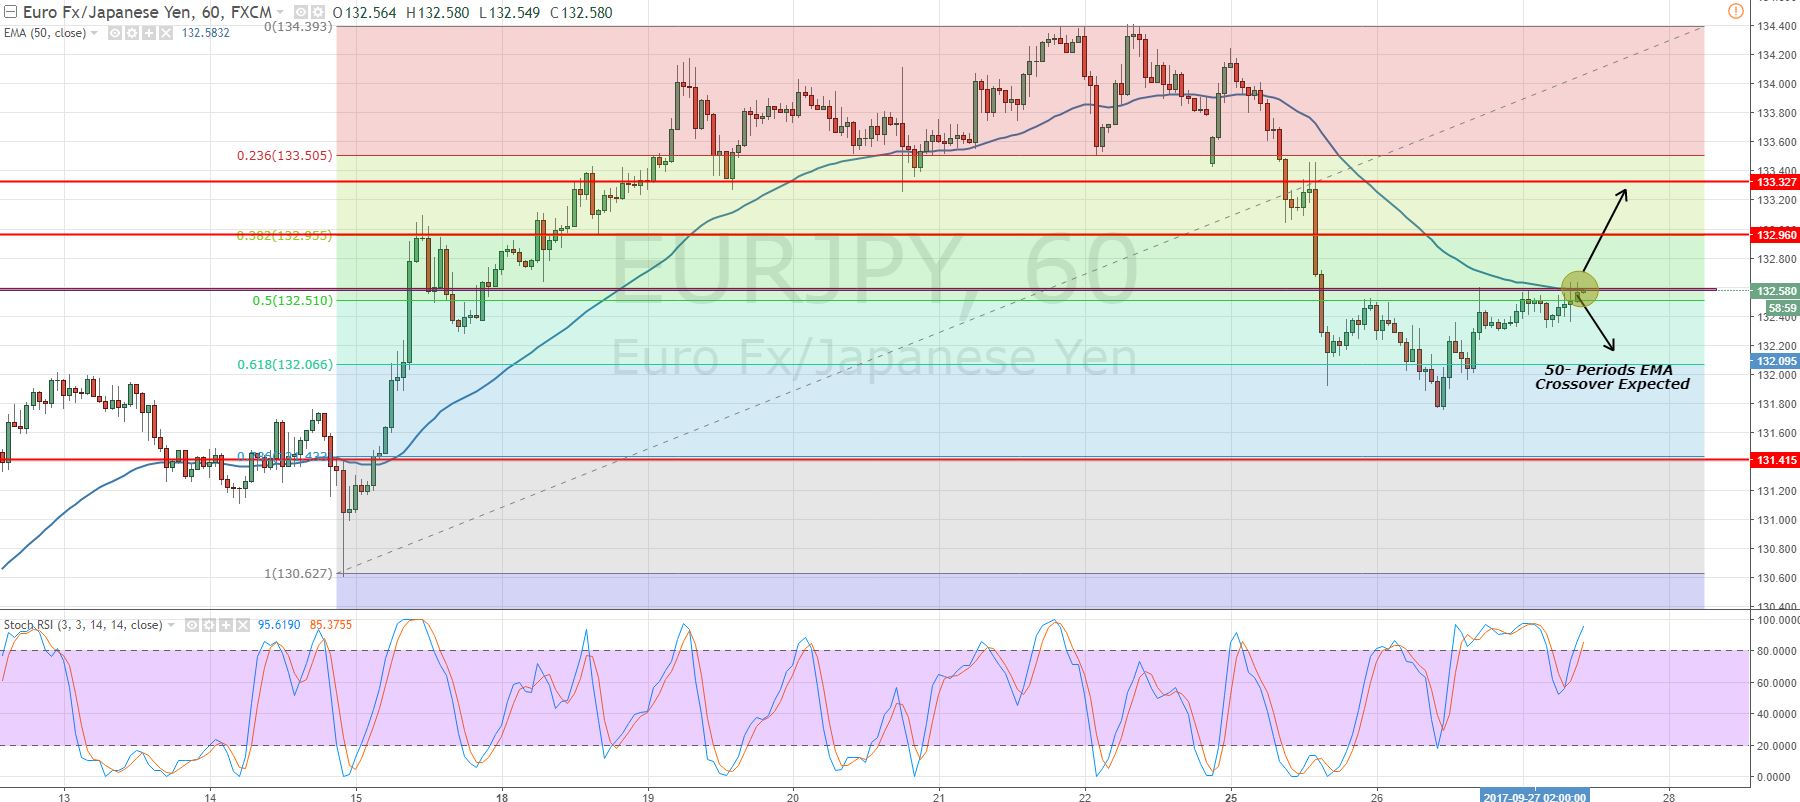
Taking a quick look at the hourly chart, the pair has reached a solid resistance level of $132.65 and at the same time testing the 50- periods EMA at $132.60.
 EURJPY – Hourly Chart – Moving Average Crossover
 EURJPY – Hourly Chart – Moving Average Crossover
Now, the point is whether EURJPY will exhibit a moving average crossover or it will hold below it to extend the selling trend. That's making $132.65 a crucial trading level. The leading indicators are heading north and soon they may enter the overbought region. Check out the intra-day support and resistance levels for EURJPY.
Support Resistance
131.86 132.71
131.38 133.08
131.01 133.56
Key Trading Level: 132.23
GBPJPY – Trading Plan
At the moment, I'm monitoring the $132.650 to decide for a bullish or bearish position. I would prefer to stay in sell below $132.650 to target $132.250. Whereas above $132.700, the market is likely to go for $133. Good luck and keep visiting us for more trading signals!
- Check out our free forex signals
- Follow the top economic events on FX Leaders economic calendar
- Trade better, discover more Forex Trading Strategies
- Open a FREE Trading Account


