Going Long on Ethereum
Yesterday we were analyzing cryptocurrencies and spotted a tendency from them to slip lower, so we decided to sell Ripple. Little did we kn
Yesterday we were analyzing cryptocurrencies and spotted a tendency from them to slip lower, so we decided to sell Ripple. Little did we know that Ripple announced the opening of another office in Southeast Asia. While the other cryptos retraced lower, Ripple surged higher.

Let's hope the ripple effect sends Ripple higher today.
Anyway, we just opened another cryptocurrency signal, but this time we’re trying Ethereum. We opened a buy Ethereum signal, so let’s see the chart setup behind this trade.
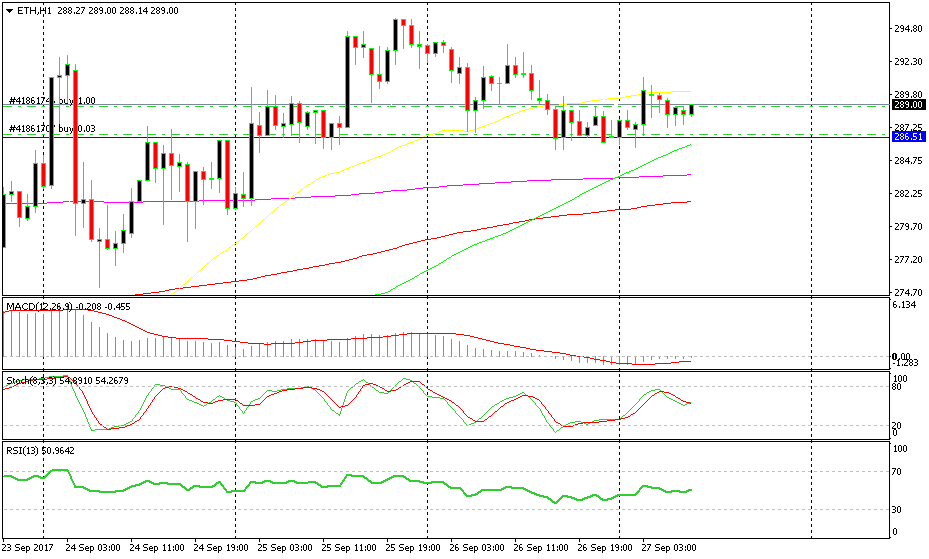 We need to break the 50 SMA (yellow) in order to move higher.
As you can see on the hourly Ethereum chart, the area around $286-7 is some sort of support, as it has been holding the price above in the last few days. It used to be resistant before.
Besides that, the last two hourly candlesticks closed as hammers with the wick down which means that buyers are jumping in when sellers try to push the price lower.
 The 100 SMA is providing support for Ripple.
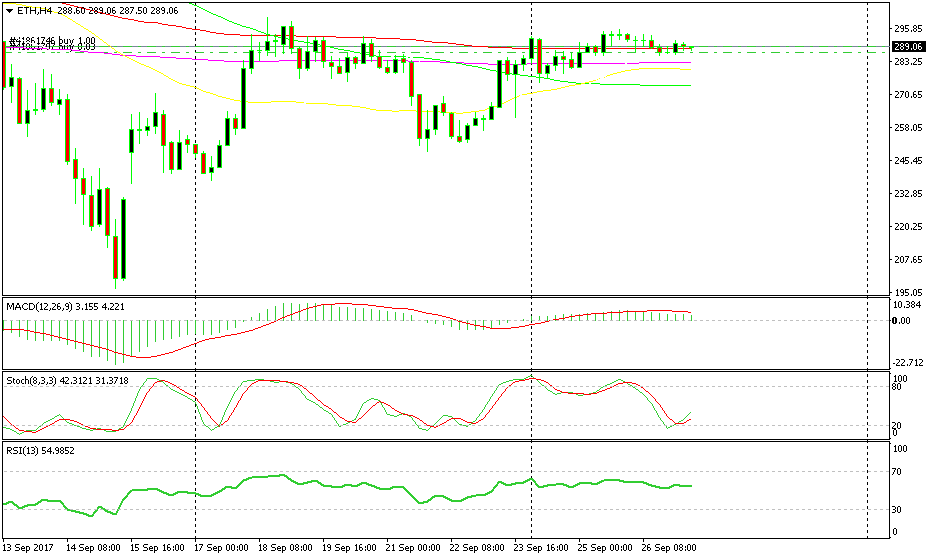
Switching to the H4 Ethereum chart we see that the stochastic indicator was overbought a while ago, and it is now turning higher. The price is above the 100 SMA (red) as well, which is providing support, so let’s hope we break the 50 SMA soon and move higher.
- Check out our free forex signals
- Follow the top economic events on FX Leaders economic calendar
- Trade better, discover more Forex Trading Strategies
- Open a FREE Trading Account