Quick Trade Setup in Nikkei – Triangle Pattern!
It's been some time, we haven't been able to capture any trade on the Japanese Index Nikkei. But today, I'm seeing a hot trade setup which
It's been some time, we haven't been able to capture any trade on the Japanese Index Nikkei. But today, I'm seeing a hot trade setup which is worth the risk.
Did you hear news about the Las Vegas Strip shooting? It's bit threatening and any sort of event like this put's the pressure on global stock market indices.
Technical Outlook
On the 4-hour chart, we can see the overbought Nikkei has started coming out of the overbought zone. It's testing the $20,450 for the third time now, making this level a triple top pattern. Below this, the Japanese Index can lead towards $20,300.
 Nikkei – Hourly Chart – Ascending Triangle Pattern
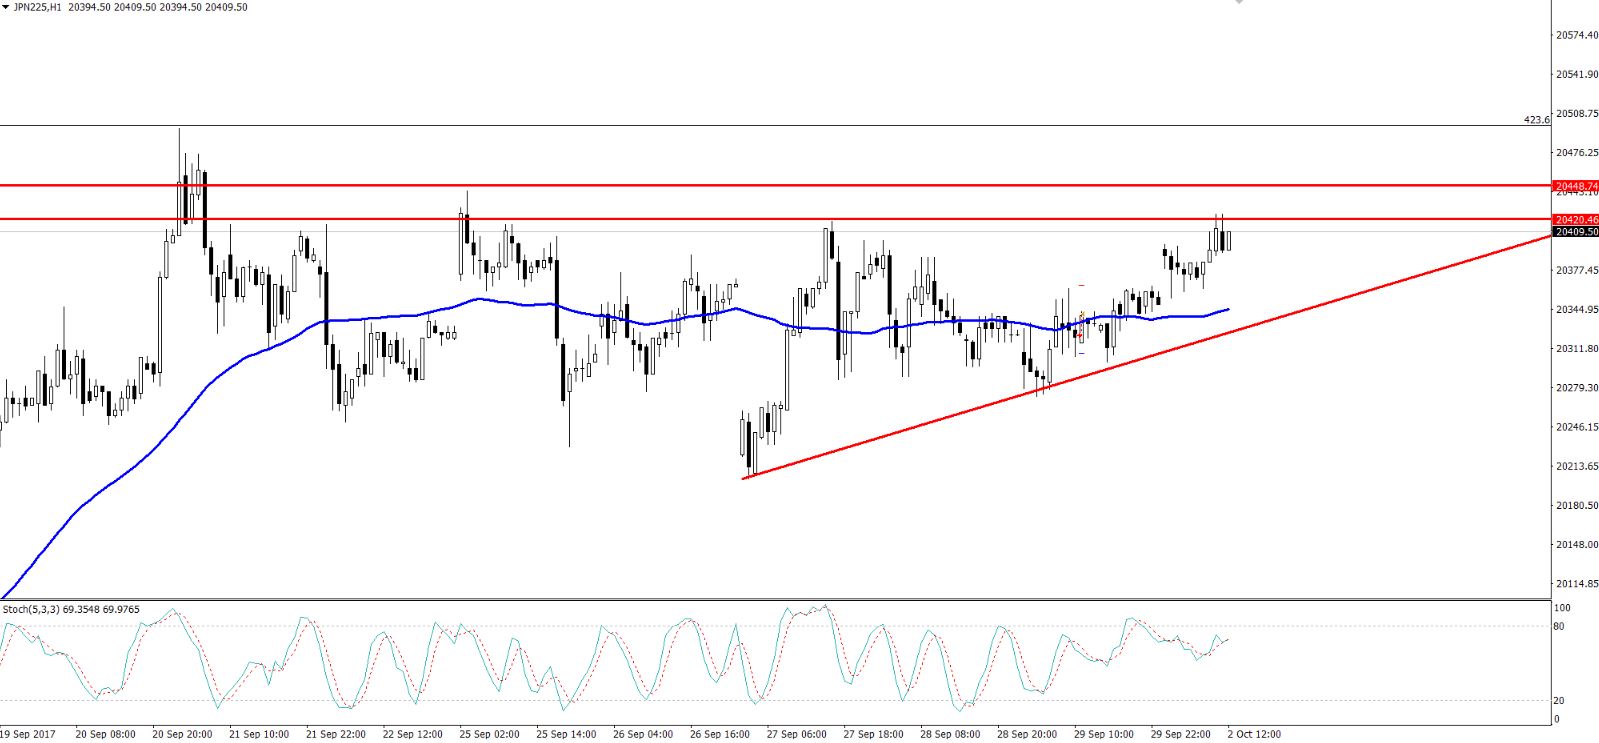 Nikkei – Hourly Chart – Ascending Triangle Pattern
 As per the RSI & Stochastics, Nikkei is coming out of the overbought zone, and it's very likely to continue a bearish trend to stay in the range $20,300 – $20,450.
Nikkei – Trading Idea
The idea is to stay in sell position below $20,450 with a stop loss above $20,550 and take profit at $20,350. Good luck fellows, make sure to follow the FX Leader's Money Management Strategy to ensure profitability.
- Check out our free forex signals
- Follow the top economic events on FX Leaders economic calendar
- Trade better, discover more Forex Trading Strategies
- Open a FREE Trading Account
- Read our latest reviews on: Avatrade, Exness, HFM and XM
Related Articles


Sidebar rates
Related Posts
