Trade Setup In The WTI Crude Oil – Sideways Channel Still Alive!
It's been more than a week now, the Crude Oil is consolidating in a narrow trading range of $51.20 - $52.35. Though, it broke out this rang
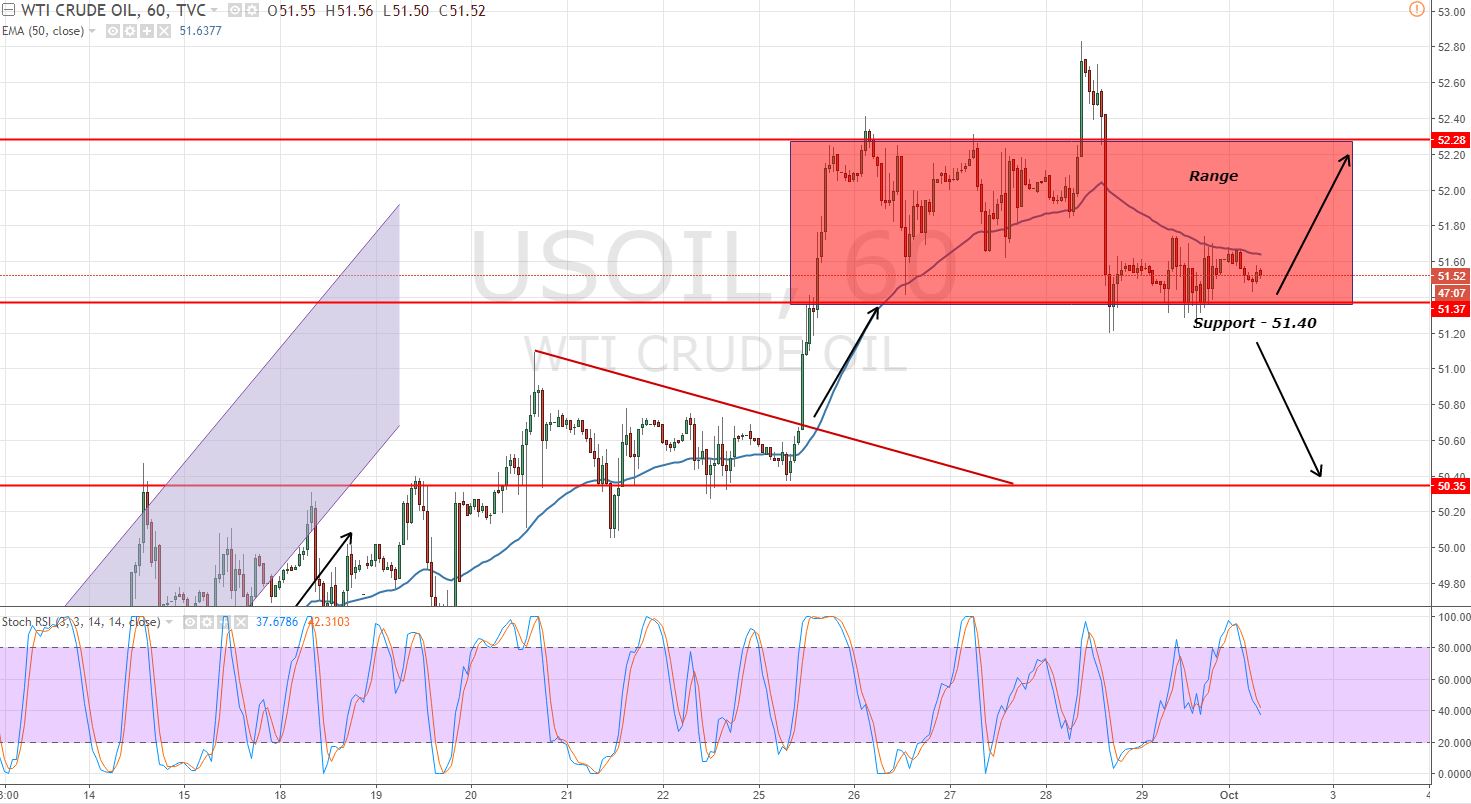
It's been more than a week now, the Crude Oil is consolidating in a narrow trading range of $51.20 – $52.35. Though, it broke out this range but managed to close the daily. Let's check out the trading plan for today.
Quick Fundamentals Review
The crude oil prices remained supported, due to the minor draw in the inventories. In the previous week, the Energy Information Administration reported a draw of 1.8 million barrels versus forecasts for a 3.4 million-barrel build. As a consequence, we encountered a slight buying trend in the crude oil, and it placed a weekly high of $52.83.
Based on the foregoing, the Crude Oil is still supported and the investors are awaiting fundamental reasons to get in the trade.
WTI Crude Oil – Technical Outlook
On the hourly chart, we can see a sideways trend in the WTI crude Oil, which indicates that neutral sentiment of investors. We can see multiple bullish and bearish 50- periods EMA crossovers, faking out the trade setups. The RSI is holding below 50, which means, at this point, buying is not a good idea.
 Crude Oil – Sideways Trend Channel – Hourly Chart
On the same chart, the oil has formed a sideways ways channel pattern which is extending a support at $451.40 and resistance at $52.30. Let's understand that the sideways channel is an indication of indecision between buyers and sellers. These are meant to breakout any direction, solely depending upon fundamentals.
Forex Trading Signal
At this point, I'm looking to try choppy trading through entering a buy position above $51.35 with a stop below $51.20 and a take profit of $51.65. Whereas, taking a sell below $51.25 in order to target $50.90 seems to be a good idea. Good luck.
- Check out our free forex signals
- Follow the top economic events on FX Leaders economic calendar
- Trade better, discover more Forex Trading Strategies
- Open a FREE Trading Account
 Crude Oil – Sideways Trend Channel – Hourly Chart

