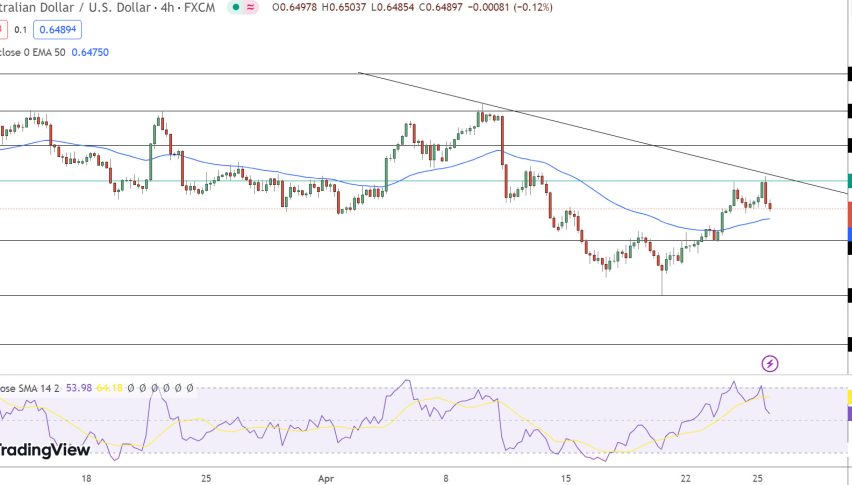
EUR/USD Stuck Between 2 Moving Averages, Up or Down?


Similarly to AUD/USD, EUR/USD has been in a downtrend for more than two weeks after failing to beak 1.21. It slipped to 1.1670 on Friday, below the 200 SMA (purple), but it has climbed back above it. Now the price is stuck between the 200 SMA at the bottom and the 50 SMA (yellow) on top.
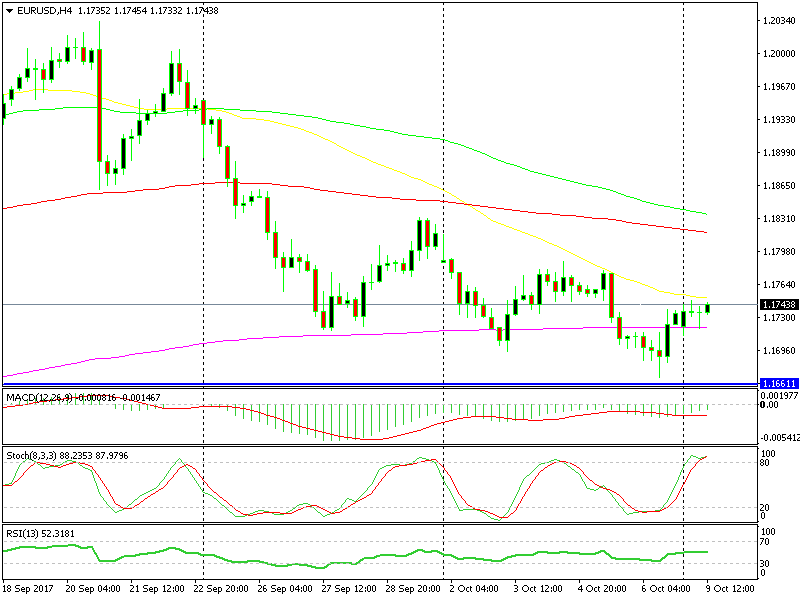 We’re getting close to the 50 SMA which is supposed to provide resistance
Looking at the H4 EUR/USD chart, anyone would think that this is just a retrace of the downtrend and it seems to be almost over. The price is at the 50 SMA which has provided resistance before and it’s likely to do the same again.
The stochastic indicator is also overbought, so there is a strong case for sellers right now.
Although, the daily chart is a bit contradictory. It has been moving down during this time, but now we have reached a prior support level which stands at 1.16060-70.
Also, the daily candlestick on Friday closed as a hammer, which means that a reverse higher is going to take place soon.
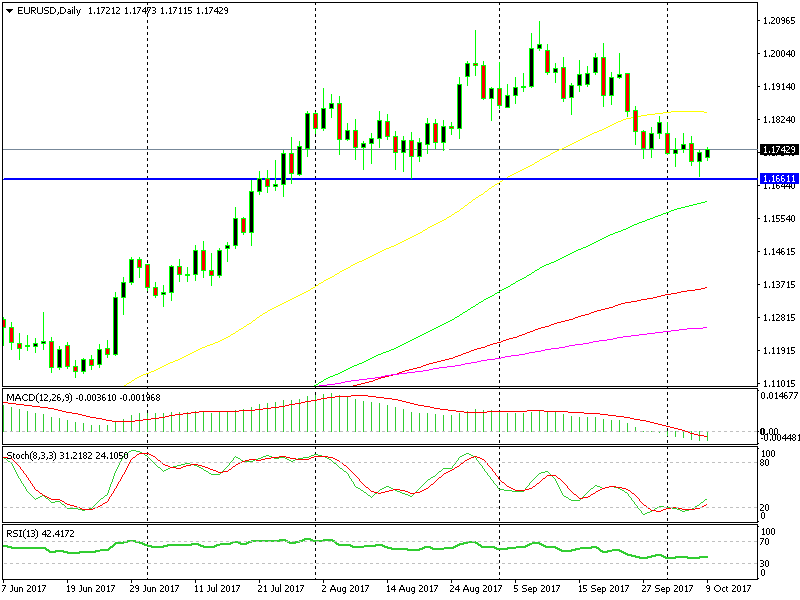 The 1.1660-70 level surely is a strong support
Well, I still think that we will see another push to the downside, so I remain bearish on this pair. I will probably sell around 1.1750-60 at the 50 SMA, with a stop above the moving average and target at 1.1710-20.