WTI Crude Oil – Sideways Range Dominates
Crude Oil has been consolidating in narrow ranges in this week, but it's a bit supported as China is back from week-long holidays. Are you
Crude Oil has been consolidating in narrow ranges in this week, but it's a bit supported as China is back from week-long holidays. Are you expecting API report today? Well, this week it's not coming out today but tomorrow. Let's see what's going on the technical side.
Quick Technical Outlook
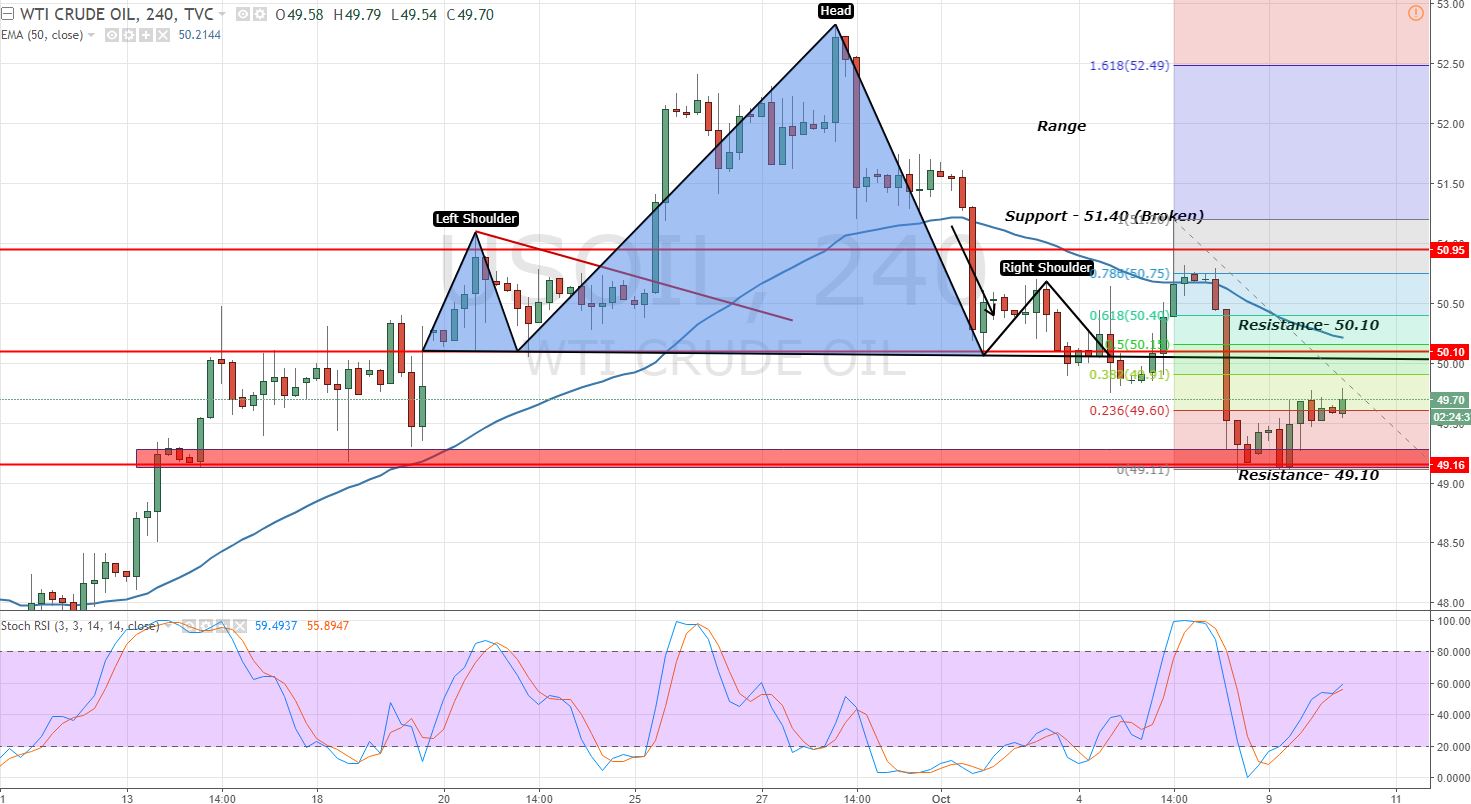
Crude Oil traded exactly as recommended in WTI Crude Oil – Sideways Pattern Awaits Breakout. The 4- hours chart is still suggesting a bullish bias for the Oil. But this has stuck in the narrow range of $49.10 – $50.10.
 Crude Oil – 4 – Hour Chart – Ranges
 Crude Oil – 4 – Hour Chart – Ranges
Crude Oil isn't oversold as the RSI and Stochastics are holding at 50 which means the total indecision among investors. In addition to this, the 23.6% retracement falls at $49.60 while 32.85% retracements stays at $49.91.
Crude Oil Trading Plan
Fellas, $49.90 is a crucial level to enter a sell or buy position. We need to wait for further confirmations in order to enter the market. Keep following as we may share a signal on Oil during the U.S. session. Good luck.
- Check out our free forex signals
- Follow the top economic events on FX Leaders economic calendar
- Trade better, discover more Forex Trading Strategies
- Open a FREE Trading Account
- Read our latest reviews on: Avatrade, Exness, HFM and XM
Related Articles


Sidebar rates
Related Posts
