Happy Friday – A Quick Technical Review of Gold!
What's up, fellas. Hope you enjoyed our previous update on Gold, Dovish FOMC Put Gold On Fire - How To Trade Today. The idea was to sel
What's up, fellas. Hope you enjoyed our previous update on Gold, Dovish FOMC Put Gold On Fire – How To Trade Today. The idea was to sell below $1,297 and buy above $1,289. Gold traded exactly in line with our forecast. Let's take a look at Gold to grab another trading opportunity.
Quick Technical View
Gold is consolidating below $1,297, struggling to break this level. Remember it's the same level that we discussed in our update on Gold a day before. We can see on the daily chart, the metal has dropped after testing the 38.2% Fibonacci resistance at $1,297. At the same time, the stochastic indicator is entering above 80, the overbought zone.
 Gold – Daily Chart – 38.2% Fibbo Level In Play?
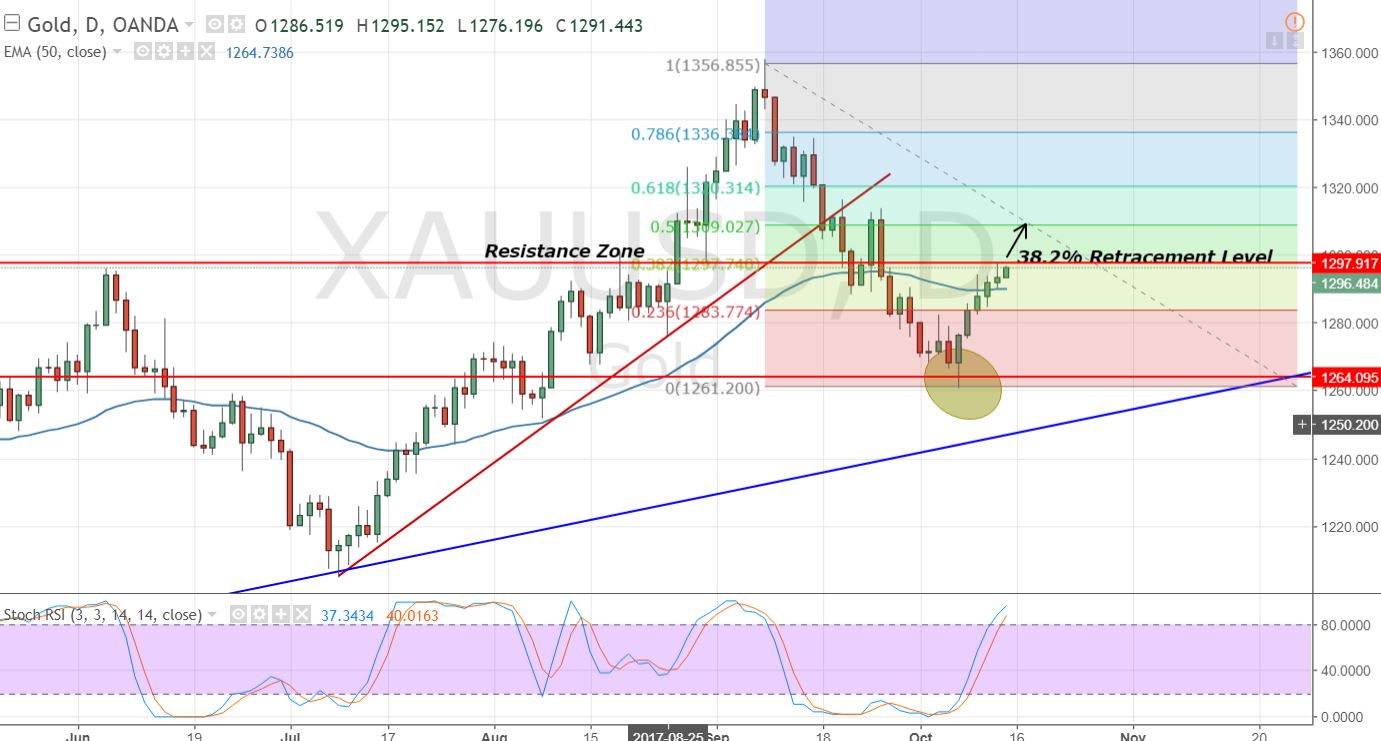
For now, $1,293 and $1,289 both are working as solid support areas. Whereas, Gold is likely to test $1,306 on the breakage of $1,297.
GOLD // XAUUSD – Intraday Trading Levels
Support Resistance
1293 1296
1288 1300
1284 1308
Gold // XAUUSD – Trading Plan
Today, the idea is to stay bullish above $1,290 in order to target $1,300 and $1,305. But wait, $1,297 is a major hurdle on the way, so keep a close eye on it. Good luck and have a nice weekend!
- Check out our free forex signals
- Follow the top economic events on FX Leaders economic calendar
- Trade better, discover more Forex Trading Strategies
- Open a FREE Trading Account
- Read our latest reviews on: Avatrade, Exness, HFM and XM
Related Articles


Sidebar rates
Related Posts
