Everything in This EUR/USD Chart Looks Dovish
During the last two weeks, I highlighted the chart setup in EUR/USD, which seemed like it was turning south after a long uptrend. This pair
During the last two weeks, I highlighted the chart setup in EUR/USD, which seemed like it was turning south after a long uptrend. This pair did fall for some time during that period, but last week it reversed back up.
 EUR/USD is trading in a 200 pip range now.
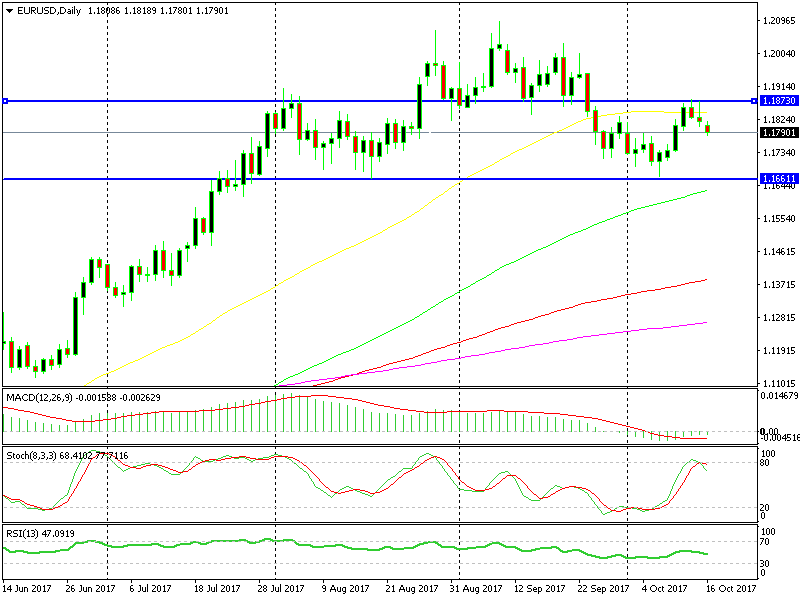
That reverse began exactly at the previous low from back in mid-August. This means that the 1.1660-70 level has become a support line to take into account.
That said, I also did highlight the 50 SMA on the daily EUR/USD chart as a possible indicator, which might provide resistance on the top side. This moving average has turned into resistance indeed, and the price seems to be turning lower now.
The last two daily candlesticks are upside down hammers which are reversal indicators. Another bearish indicator is the 1.1870-80 level which has played resistance and support before and now it is providing resistance again.
Also, the stochastic indicator is oversold and is heading down: So, all technical indicators are pointing down. We’re on the right side here; let’s just hope the 1.1660 level gives way this time.
- Check out our free forex signals
- Follow the top economic events on FX Leaders economic calendar
- Trade better, discover more Forex Trading Strategies
- Open a FREE Trading Account
- Read our latest reviews on: Avatrade, Exness, HFM and XM
Related Articles


Sidebar rates
Related Posts
