Four Reasons for Our S&P Forex Signal
We just opened a buy forex signal in S&P, as you might have noticed by the sound or if you are a premium member by the alert on your mobile
We just opened a buy forex signal in S&P, as you might have noticed by the sound or if you are a premium member by the alert on your mobile.
According to the charts, this is a pretty straight forward trade. If we look at the H4, daily or weekly charts we see that S&P has been trading in an uptrend in like forever. But this is a short term forex signal, so we are trading short term charts.
The H1 chart is the highest timeframe to look at for such signals/trades. Sometimes you can use the H4 charts for financial instruments but these timeframe charts are more useful for low volatility instruments, such as EUR/CHF.
Anyway, we opened this signal because the price in S&P had been retracing lower all morning after the jump in the first hours of the morning when the Tokyo session started.
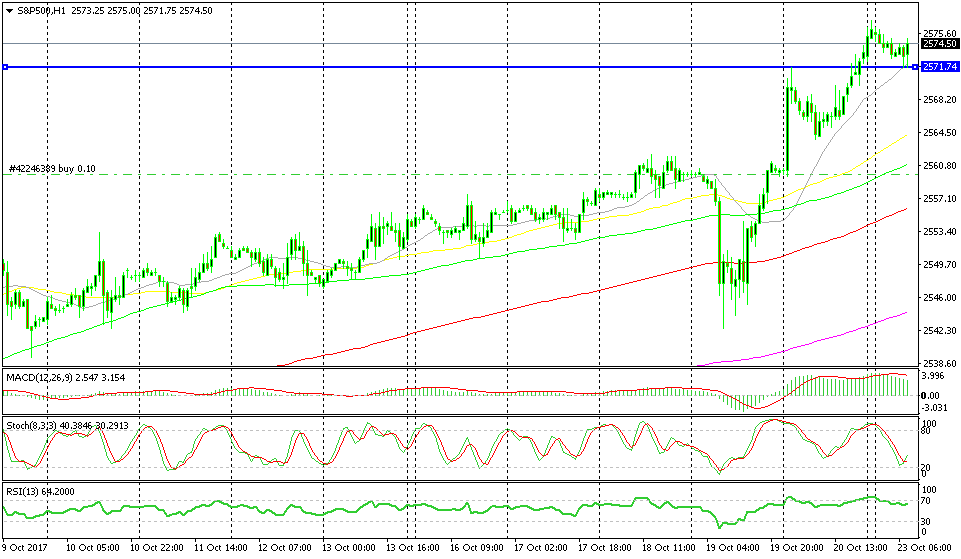 If the hourly candlestick closes as it is, then this would be another bullish indicator.
First, the hourly chart is oversold since the stochastic indicator has reached the oversold area. Second, we have reached the 20 SMA (grey) which is providing support.
Friday’s resistance is now turning into support which adds extra strength to the resistance, so it’s three indicators now. The fourth technical indicator is the trend, the recent trend. S&P has surged since it made a decent pullback on Thursday, so the trend is bullish and it is strong. There you go, four indicators pointing up. All we have to do now is leave this trade run its course.
- Check out our free forex signals
- Follow the top economic events on FX Leaders economic calendar
- Trade better, discover more Forex Trading Strategies
- Open a FREE Trading Account